Experiment 9: Real World Project
advertisement
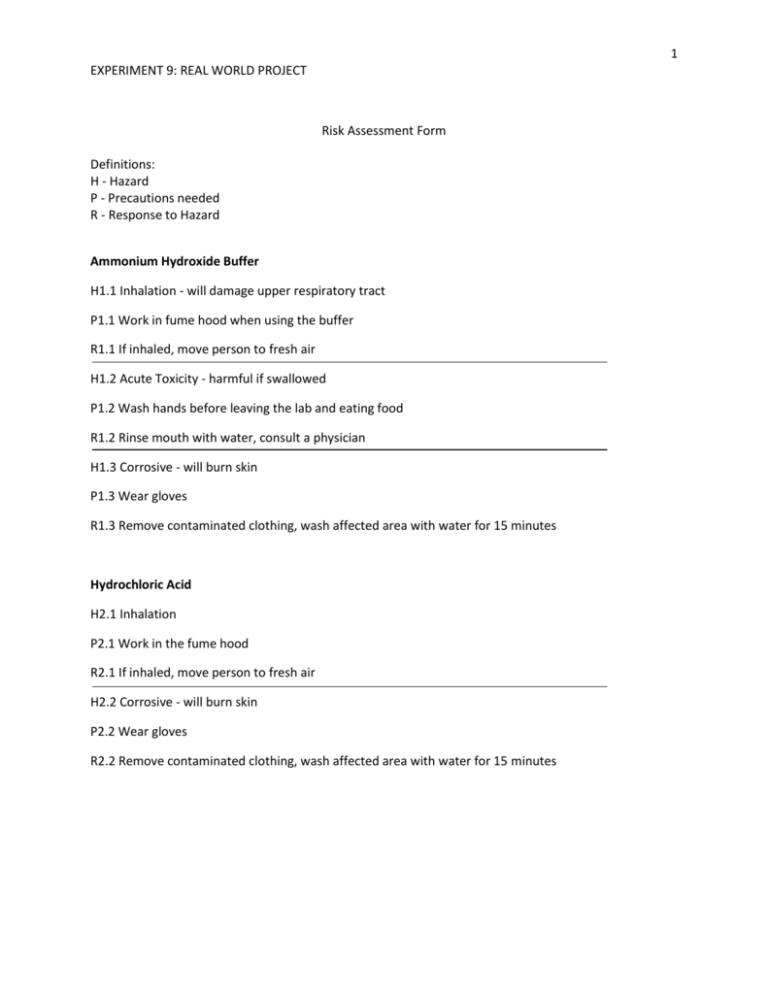
1 EXPERIMENT 9: REAL WORLD PROJECT Risk Assessment Form Definitions: H - Hazard P - Precautions needed R - Response to Hazard Ammonium Hydroxide Buffer H1.1 Inhalation - will damage upper respiratory tract P1.1 Work in fume hood when using the buffer R1.1 If inhaled, move person to fresh air H1.2 Acute Toxicity - harmful if swallowed P1.2 Wash hands before leaving the lab and eating food R1.2 Rinse mouth with water, consult a physician H1.3 Corrosive - will burn skin P1.3 Wear gloves R1.3 Remove contaminated clothing, wash affected area with water for 15 minutes Hydrochloric Acid H2.1 Inhalation P2.1 Work in the fume hood R2.1 If inhaled, move person to fresh air H2.2 Corrosive - will burn skin P2.2 Wear gloves R2.2 Remove contaminated clothing, wash affected area with water for 15 minutes 2 EXPERIMENT 9: REAL WORLD PROJECT Intro: The purpose of this lab is to look deeper into EDTA titrations by testing the hardness of various tap water samples. This lab is a recap of Experiment 6, in which EDTA was first standardized, then tested against an antacid tablet containing Calcium and tap water. The lab helps enhance the understanding of how EDTA titrations work, and how they react with metals. Procedure: A pH meter was calibrated and used to test ammonium buffer. HCl and NaOH would be added to the ammonium until a pH of 10 was reached. An EDTA solution (~0.01 M) was prepared using 1 g of EDTA, 5 mL of ammonium buffer, and diluting it to 250 mL. A CaCO3 solution (~0.05 M) was prepared using 0.5 g CaCO3 (s) and dissolved in 100 mL of 0.15 M HCl. The EDTA was then standardized with the CaCO3 with calagamite indicator. This process was repeated 3 times until good titrations were recorded. For each source of tap water, 3 x 100 mL samples with 5 mL buffer and calagamite were titrated with EDTA until good titrations were recorded. Data: Refer to Excel Spreadsheet Calculations: Mass EDTA Required Moles CaCO3 𝑉 𝐸𝐷𝑇𝐴 ∗ 0.1 𝑚𝑜𝑙 𝐸𝐷𝑇𝐴 372.24 𝑔 𝐸𝐷𝑇𝐴 ∗ 1𝐿 1 𝑚𝑜𝑙 𝐸𝐷𝑇𝐴 𝑚𝑎𝑠𝑠 𝐶𝑎𝐶𝑂3 ∗ 1 𝑚𝑜𝑙 𝐶𝑎𝐶𝑂3 100.09 𝑔 𝐶𝑎𝐶𝑂3 Molarity EDTA 𝑉 𝐶𝑎𝐶𝑂3 ∗ 𝑚𝑜𝑙 𝐶𝑎𝐶𝑂3 1 ∗ 1 𝐿 𝐶𝑎𝐶𝑂3 𝑉 𝐸𝐷𝑇𝐴 Concentration Ca2+ 𝑉 𝐸𝐷𝑇𝐴 ∗ 𝑚𝑜𝑙 𝐸𝐷𝑇𝐴 1 ∗ 1 𝐿 𝐸𝐷𝑇𝐴 𝑉 𝑊𝑎𝑡𝑒𝑟 Hardness of Water (ppm) 𝑚𝑜𝑙 𝐶𝑎 40.078 𝑔 𝐶𝑎 1000 𝑚𝑔 ∗ ∗ 1 𝐿 𝐶𝑎 1 𝑚𝑜𝑙 𝐶𝑎 1𝑔 Spike Recovery % [𝐶𝑎2+] 𝑒𝑥𝑝𝑒𝑟𝑖𝑚𝑒𝑛𝑡 ∗ 100% [𝐶𝑎2+] 𝑇ℎ𝑒𝑜𝑟𝑒𝑡𝑖𝑐𝑎𝑙 0.25 𝐿 ∗ 0.1 𝑚𝑜𝑙 𝐸𝐷𝑇𝐴 372.24 𝑔 𝐸𝐷𝑇𝐴 ∗ = 1.02𝑔 𝐸𝐷𝑇𝐴 1𝐿 1 𝑚𝑜𝑙 𝐸𝐷𝑇𝐴 0.5024 𝐶𝑎𝐶𝑂3 ∗ 1 𝑚𝑜𝑙 𝐶𝑎𝐶𝑂3 = 0.0502 𝑚𝑜𝑙 𝐶𝑎𝐶𝑂3 100.09 𝑔 𝐶𝑎𝐶𝑂3 0.005 𝐿 𝐶𝑎𝐶𝑂3 ∗ 0.0502 𝑚𝑜𝑙 𝐶𝑎𝐶𝑂3 1 𝐿 𝐶𝑎𝐶𝑂3 ∗ 1 =0.0099 M 0.04950 𝐸𝐷𝑇𝐴 EDTA 0.00873 𝐿 𝐸𝐷𝑇𝐴 ∗ 0.000994𝑚𝑜𝑙 𝐶𝑎 1 𝐿 𝐶𝑎 0.0099 𝑚𝑜𝑙 𝐸𝐷𝑇𝐴 1 𝐿 𝐸𝐷𝑇𝐴 ∗ 40.078 𝑔 𝐶𝑎 1 𝑚𝑜𝑙 𝐶𝑎 ∗ ∗ 1 0.1 𝐿 𝑊𝑎𝑡𝑒𝑟 1000 𝑚𝑔 1𝑔 =0.000994 M Ca =39.85 ppm 63.16 ∗ 100% = 59.50% 𝑟𝑒𝑐𝑜𝑣𝑒𝑟𝑦 106.15 3 EXPERIMENT 9: REAL WORLD PROJECT Conclusion: Overall, the experiment was successful up to the point of the spike recovery. A whole new EDTA solution had to be made just for the spike solution, because I had run out prior to this portion of the lab. Because the new EDTA solution was not the same as the one prior to the spike, there was some error to be had. Along with this, I also decided to use a 0.06 M HCl to dissolve the CaCO3, rather than the 0.15 M in the previous lab, so this also added to the error.
