CHEMICAL EQUILIBRIUM
advertisement
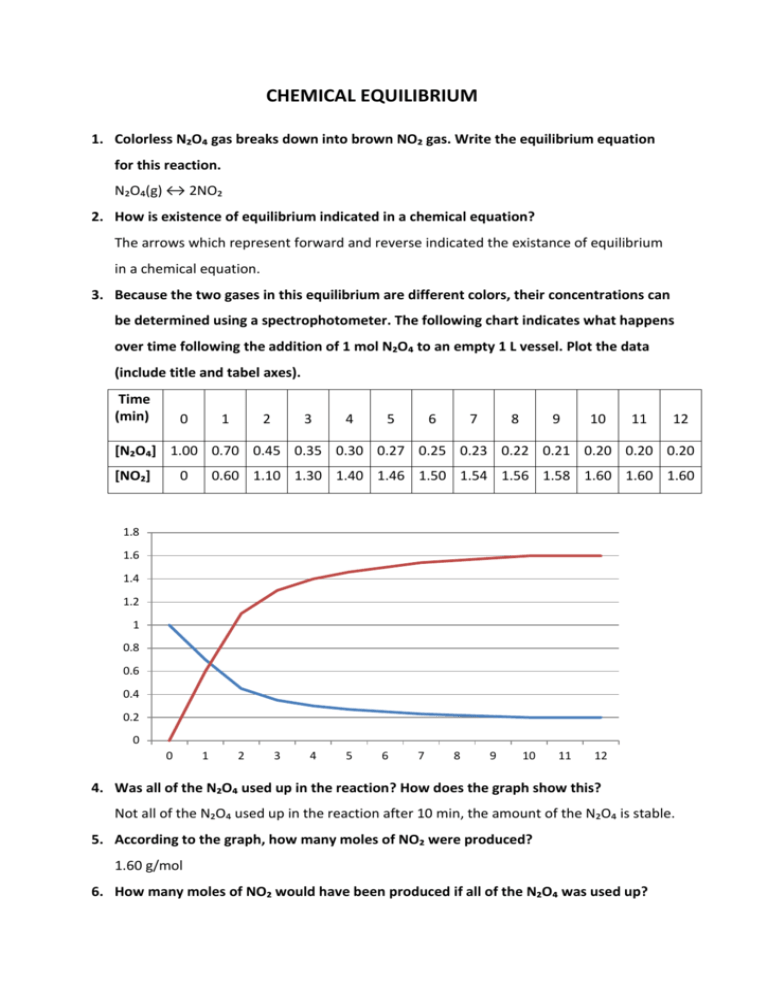
CHEMICAL EQUILIBRIUM 1. Colorless N₂O₄ gas breaks down into brown NO₂ gas. Write the equilibrium equation for this reaction. N₂O₄(g) ↔ 2NO₂ 2. How is existence of equilibrium indicated in a chemical equation? The arrows which represent forward and reverse indicated the existance of equilibrium in a chemical equation. 3. Because the two gases in this equilibrium are different colors, their concentrations can be determined using a spectrophotometer. The following chart indicates what happens over time following the addition of 1 mol N₂O₄ to an empty 1 L vessel. Plot the data (include title and tabel axes). Time (min) 0 1 2 3 4 5 6 7 8 9 10 11 12 [N₂O₄] 1.00 0.70 0.45 0.35 0.30 0.27 0.25 0.23 0.22 0.21 0.20 0.20 0.20 [NO₂] 0 0.60 1.10 1.30 1.40 1.46 1.50 1.54 1.56 1.58 1.60 1.60 1.60 1.8 1.6 1.4 1.2 1 0.8 0.6 0.4 0.2 0 0 1 2 3 4 5 6 7 8 9 10 11 12 4. Was all of the N₂O₄ used up in the reaction? How does the graph show this? Not all of the N₂O₄ used up in the reaction after 10 min, the amount of the N₂O₄ is stable. 5. According to the graph, how many moles of NO₂ were produced? 1.60 g/mol 6. How many moles of NO₂ would have been produced if all of the N₂O₄ was used up? If all of the N₂O₄ was used up, we would have 2 mole of NO₂ 7. Assume the spectrophotometer cannot directly measure [N₂O₄], but can measure [NO₂] because of its brown color. Explain how the [N₂O₄] values would be calculated. According to equilibrium conditions if I know the initial concentration of the N₂O₄ and NO₂ gases and final concentration of NO₂, I would calculate the [N₂O₄] which have been consumed and remaining. 8. Define reaction reversibility. Forward and reverse reaction takes of the same time. 9. Can the same equilibrium be reached starting with pure NO₂? If so, how much NO₂ would be required? 2 mol 10. HI can form via the equation H₂(g) + I₂(g) ↔ 2H(g). 1 mol H₂ and 1 mol I₂ were placed in a 1 L vessel (no HI was represent initially). At equilibrum [HI] was measured to be 1.56 mol/L. Sketch a graph for the equilibrium reaction, clearly indicating the satarting and equilibrium concentrations of all chemicals. (Be carefull to draw the general shape of the lines correctly: straight vs. curving up vs. curving down). INTRODUCTION TO EQUILIBRIUM PART 1 Table 1: Volume after x transfers (2 large straws) X 0 1 2 3 4 5 6 7 8 9 10 11 12 13 14 15 16 17 ml 50 43 43,1 37,2 38,2 33 34,9 30 32 34 29,9 31,8 27,9 30 26,4 29 25,4 26,2 25,1 26 23,9 25,1 23 25 24,9 0 6,9 6,7 12,2 11,2 16,9 15 19,9 17,4 15,9 20 18 21,9 19,2 23 20,2 24 22,9 19 22 25,1 23,8 26 24 24,9 ml Part 2: Table 2: Volume after X transfers (1 large straw, 1 small straw) X 0 ml 50 1 2 42,9 42,9 3 37 4 0 7 7 13 6 7 37,1 32,1 32,9 28,8 18,2 14,3 15,4 12,4 13,8 ml 5 16 8 9 29 25 10 11 12 13 25,9 22,1 23,1 19,5 20,7 15 17 17 12,9 17,3 16,9 21,1 20,9 24,8 23,9 27,8 26,7 30,2 26,1 32,8 31,7 35,5 34,5 37,5 36,1 34 33 1) Draw a line across a piece of graph paper. Plot two graphs – one for each table. Note that “number of transfers” is the independent variable (i.e. it goes on the x – axis). Connect values so that there are two continuous lines on each of the two graphs (Note: sequential data points should be connected with straight lines.) 14 Graph of table 1: 60.00 50.00 40.00 Series1 30.00 Series2 20.00 10.00 0.00 1 2 3 4 5 6 7 8 9 10 11 12 13 14 15 16 17 18 19 20 21 22 23 24 25 26 27 Graph of table 2: 60 50 40 Series1 30 Series2 20 10 0 1 2 3 4 5 6 7 8 9 10 11 12 13 14 15 16 17 18 19 20 21 22 23 2) Assuming that Part 1 simulates the reaction A (reactant) – B (product) what do these represent: i. Volume of water in cylinder #1 (50 ml to start), concentration of forward reaction ii. Volume of water from #1 to #2, concentration of backward reaction iii. Transferring water from #1 to #2, forward reaction iv. Transferring water from #2 to #1, backward reaction v. Number of transfers, duration of reactions vi. Diameter of straws, rate of reaction 3) What are the two important defining characteristics of a dynamic equilibrium? How can you tell by looking at your graphs when equilibrium has been stablished? There are two important characteristics of a dynamic equilibrium. These are reversibility and not going completion. 4) How can you tell by looking at a graph which reaction is (forward or reverse) is favored?


