The Comparison of Function g(x)=x to g(x)=x +1
advertisement
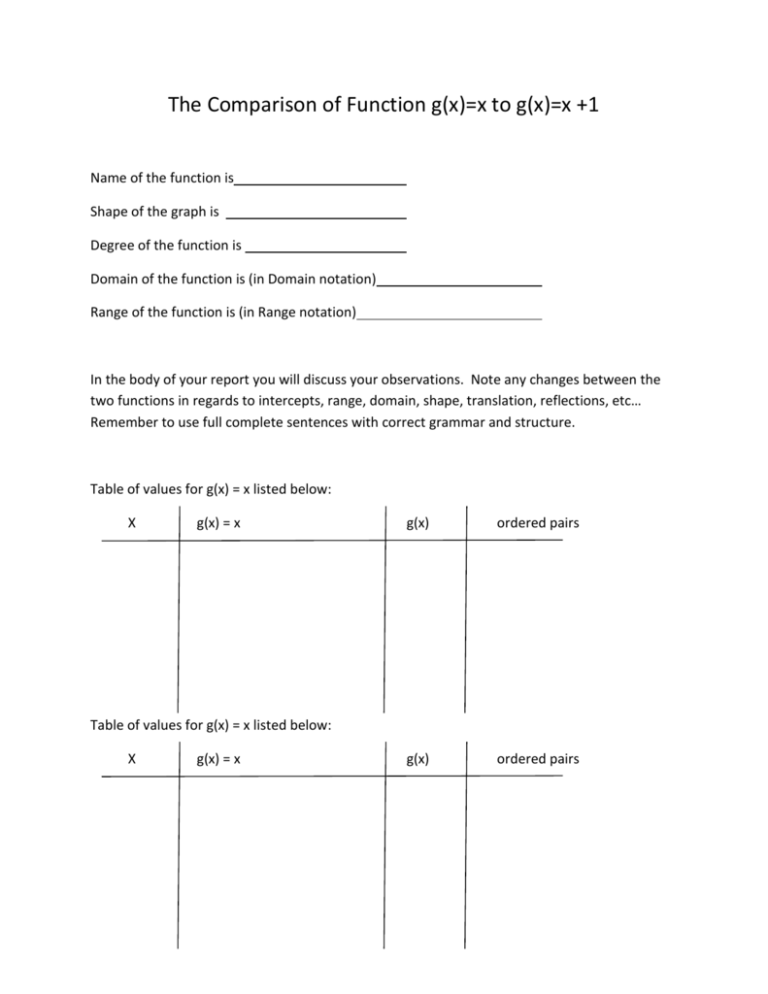
The Comparison of Function g(x)=x to g(x)=x +1 Name of the function is Shape of the graph is Degree of the function is Domain of the function is (in Domain notation) Range of the function is (in Range notation) In the body of your report you will discuss your observations. Note any changes between the two functions in regards to intercepts, range, domain, shape, translation, reflections, etc… Remember to use full complete sentences with correct grammar and structure. Table of values for g(x) = x listed below: X g(x) = x g(x) ordered pairs g(x) ordered pairs Table of values for g(x) = x listed below: X g(x) = x See below for grading rubric: 16-20 Poster Boards 11-15 6-10 0-5 Your graphing shows that you have spent quality time in constructing and evaluating your project. You have met all of the criteria listed in the procedures of this project. Function is accurately and clearly graphed on poster. The function is clearly displayed at top of each graph. Coordinate plane is accurately labeled (the axes, numbering). The plane is accurately represented on your poster. You have accurately annotated the x and y intercepts. Your graph is missing the function at the top of the graph. You have met the criteria listed in the procedures. Coordinate plane is missing 1 or 2 labeled elements. The function’s graph is accurately represented and clearly graphed. You have accurately annotated the x and y intercepts. Your project shows that you have not spent enough time and attention to detail. The function is not labeled at the top of the graph. The coordinate plane is missing 3 or more elements. The graph is not clearly represented on the poster board. You have failed to accurately annotate the x and y intercepts. You have missed at most 3 elements listed in the procedures. You project shows an apparent lack of effort and little if any attention to detail. The function is not accurately graphed. Your graph is missing most if not all required elements. Your coordinate plane is hastily constructed, messy, or otherwise inadequate. You have not annotated the x and y intercepts. You have missed at least 4 elements listed in the procedures. 16-20 Reports 11-15 6-10 0-5 Your reports follow the format listed on the report example. You have made at least 5 quality observations and have discussed them using appropriate math terminology and vocabulary. You have neatly written your reports. You have Your reports follow the format listed on the report example. You have made at only 4 quality observations and have discussed them using appropriate math terminology and vocabulary. You have neatly written your reports. You have Your reports fail to follow the format listed on the report example. You have made only 23 quality observations. You failed to discuss them using appropriate math terminology and vocabulary. You have not neatly written your reports. You have Your reports fail to follow the format listed on the report example. You have made only 23 quality observations. You failed to discuss them using appropriate math terminology and vocabulary. You have not neatly written your reports. You have listed the name, shape, degree, domain, and range of each function. Domain and range is accurately written in domain and range notation. You have included a cover page for your reports. You have no grammatical, punctuation, spelling, or other literary errors in your report. Your reports show that you have spent quality time and attention to detail in thinking about the relationships between the functions based on your discussed observations. Your table of values is displayed according to the example given. There are no errors in your mathematical computations. The table is accurately and neatly constructed to display accurate ordered pairs. listed the name, shape, degree, domain, and range of each function. Domain and range is accurately written in domain and range notation. You have included a cover page for your reports. You have less than four grammatical, punctuation, spelling, or other literary errors in your report. Your reports show that you have spent quality time and attention to detail in thinking about the relationships between the functions based on your discussed observations. Your table of values is displayed according to the example given. There are less than 4 total errors in your mathematical computations. The table is accurately and neatly constructed to display accurate ordered pairs. failed to list one or more of the following: name, shape, degree, domain, and range of each function. Domain and range is not accurately written in domain and range notation. You have not included a cover page for your reports. You have more than four grammatical, punctuation, spelling, or other literary errors in your report. Your reports show that you have spent little quality time and attention to detail in thinking about the relationships between the functions based on your discussed observations. Your table of values is not displayed according to the example given. There are more than four errors in your mathematical computations. The table is not accurately or neatly constructed. Ordered pairs are incorrect or missing. failed to list one or more of the following: name, shape, degree, domain, and range of each function. Domain and range is not accurately written in domain and range notation. You have not included a cover page for your reports. You have more than four grammatical, punctuation, spelling, or other literary errors in your report. Your reports show that you have spent little quality time and attention to detail in thinking about the relationships between the functions based on your discussed observations. Your table of values is not displayed according to the example given. There are many errors in your mathematical computations. The table is not accurately or neatly constructed. Ordered pairs are incorrect or missing.

