姓名: 學號: Final Exam(C) Economics (I), 2014 Exam date: 2014.1.15
advertisement
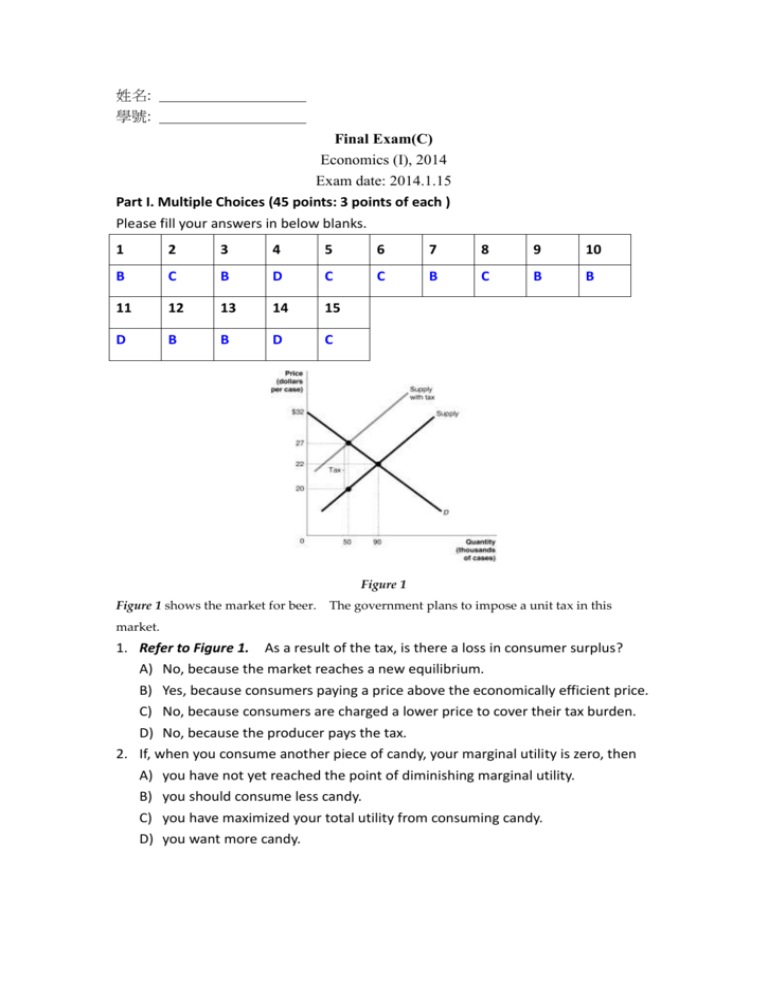
姓名: 學號: Final Exam(C) Economics (I), 2014 Exam date: 2014.1.15 Part I. Multiple Choices (45 points: 3 points of each ) Please fill your answers in below blanks. 1 2 3 4 5 6 7 8 9 10 B C B D C C B C B B 11 12 13 14 15 D B B D C Figure 1 Figure 1 shows the market for beer. The government plans to impose a unit tax in this market. 1. Refer to Figure 1. As a result of the tax, is there a loss in consumer surplus? A) No, because the market reaches a new equilibrium. B) Yes, because consumers paying a price above the economically efficient price. C) No, because consumers are charged a lower price to cover their tax burden. D) No, because the producer pays the tax. 2. If, when you consume another piece of candy, your marginal utility is zero, then A) you have not yet reached the point of diminishing marginal utility. B) you should consume less candy. C) you have maximized your total utility from consuming candy. D) you want more candy. Figure 2 The graphs in Figure 2 represent the perfectly competitive market demand and supply curves for the apple industry and demand and cost curves for a typical firm in the industry. 3. Refer to Figure 2. Which of the following statements is true? A) The current market price is $3 but the price will fall in the long-run as a result of a decrease in demand. B) The current market price is $3 but the price will fall in the long-run as new firms enter the market. C) The current market price is $3 but the price will increase in the future as the market demand increases. D) The current market price is $3 but the firm will be able to increase the price in the future. 4. Refer to Figure 2. The graphs depicts a short run equilibrium. How will this differ from the long-run equilibrium? (Assume this is a constant-cost industry.) A) The price will be higher in the long run than in the short run. B) Fewer firms will be in the market in the long run than in the short run. C) The market supply curve will be further to the left in the long run than in the short run. D) The firm's profit will be lower in the long run than in the short run. Figure 3 5. Refer to Figure 3. What is the allocatively efficient output for the firm represented in the diagram? A) Qf units. B) Qg units. C) Qh units. D) Qj units. Figure 4 6. Refer to Figure 4. Which diagram demonstrates a decrease in total utility following an increase in the price of candy? A) the movement from e to d in Panel A. B) the movement from g to f in Panel B. C) the movement from k to h in Panel C. D) none of the above. Figure 5 Fancy Footwear manufactures shoes. Figure 5 shows Fancy Footwear's marginal product of labor and average product of labor curves in the short run. 7. Refer to Figure 5. For what quantity of labor does production display diminishing returns? A) for more than 1 units of labor. B) for more than 4 units of labor. C) for more than 5 units of labor. D) for more than 8 units of labor. 8. Which of the following is not a characteristic of a monopolistically competitive market structure? A) There is a large number of independently acting small sellers. B) All sellers sell products that are differentiated. C) Each firm must react to actions of other firms. D) There are low barriers to entry of new firms. 9. If the demand curve for a firm is downward-sloping, its marginal revenue curve A) will lie above the demand curve. B) will lie below the demand curve. C) is horizontal. D) is the same as the demand curve. Figure 6 Figure 6 shows the market for apartments in Springfield. Recently, the government imposed a rent ceiling of $1,000 per month. 10. Refer to Figure 6. What is the value of the portion of producer surplus transferred to consumers as a result of the rent ceiling? A) $40,000. B) $100,000. C) $125,000. D) $140,000. 11. Consider a downward-sloping demand curve. When the price of an inferior good decreases, the income and substitution effects A) work in the same direction to increase quantity demanded. B) work in the same direction to decrease quantity demanded. C) work in opposite directions and quantity demanded decreases. D) work in opposite directions and quantity demanded increases. 12. If the marginal cost curve is below the average variable cost curve, then A) average variable cost could either be increasing or decreasing. B) average variable cost is decreasing. C) average variable cost is increasing. D) marginal cost must be decreasing. Figure 7 13. Refer to Figure 7. Suppose the prevailing price is $20 and the firm is currently producing 1,350 units. In the long-run equilibrium, the firm represented in the diagram A) will reduce its output to 750 units. B) will reduce its output to 1,100 units. C) will cease to exist. D) will continue to produce the same quantity. Figure 8 Figure 8 shows short-run cost and demand curves for a monopolistically competitive firm in the market for designer watches 14. Refer to Figure 8.What is the area that represents the loss made by the firm? A) the area P0acP2. B) the area P1bcP2. C) the area P0adP3. D) the area P2cdP3. 15. Refer to Figure 8. Should the firm represented in the diagram continue to stay in business despite its losses? A) B) C) D) No, it should shut down. Yes, it should increase its revenue by raising its price. Yes, its total revenue covers its variable cost. No, it is not able to cover its fixed cost. Part II. True and False (Answer True or False and explain, 20 points) 1. Consumers in a monopolistically competitive market do not receive any consumer surplus because the price paid for the product exceeds the marginal cost of production. F 2. A perfectly competitive firm in a constant-cost industry produces 1,000 units of a good at a total cost of $50,000. If the prevailing market price is $48, the number of firms and the industry's output will decrease in the long run. T 3. A consumer maximizes her total utility from a bundle of goods when her marginal utility from each good is equal. F 4. If the demand curve for a product is vertical, any tax increase on the product is paid for entirely by the consumer. T 5. Advertising could make the monopolistic competitor's demand more inelastic, but advertising has no effect on a perfect competitor's demand. T Part III. Problems(40 points) 1. Both the perfectly competitive firm and the monopolistically competitive firm produce at the output where marginal revenue equals marginal cost (MR = MC) but only the perfectly competitive firm achieves allocative efficiency. Explain why this is the case. ANS Unlike the perfectly competitive firm, the monopolistically competitive firm faces a downward sloping demand curve which means that the firm must lower its price to sell additional units of output. As a result, price will always be greater than marginal revenue (P > MR). By contrast, the perfectly competitive firm faces a horizontal demand curve and P= MR. The profit-maximizing rule, MR = MC, applies to all firms but because in perfect competition P = MR the rule can be written as P = MC. A firm achieves allocative efficiency if it charges a price equals to the MC of producing the last unit. This condition is satisfied at the profit-maximizing output for the perfectly competitive firm (since P = MC = MR) but will not hold for the profit maximizing output of monopolistically competitive firm for which P > MR = MC Figure 9 2. Refer to Figure 9 above to solve the following problems. (1) Calculate the fixed cost of production. (2) Calculate the average total cost of production when the firm produces 20 units of output. (3) Calculate the average variable cost of production when the firm produces 20 units of output. (4) Calculate the average fixed cost of production when the firm produces 20 units of output. (5) If the firm increases output from 15 to 20 units what is the marginal cost of output? ANS (1) 100 (2) 22.5 (3) 17.5 (4) 5 (5) 14 Price per Quantity Quantity Bushel Demanded Supplied (dollars) (bushels) (bushels) $2 40,000 4 34,000 4,000 6 28,000 8,000 8 24,000 16,000 10 20,000 20,000 12 18,000 28,000 14 12,000 36,000 16 6,000 40,000 0 Table 1 Table 1 above contains information about the corn market. Answer the following questions based on this table 3. Refer to Table 1. An agricultural price floor is a price that the government guarantees farmers will receive for a particular crop. Suppose the federal government sets a price floor for corn at $12 per bushel. (1) What is the amount of shortage or surplus in the corn market as result of the price floor? (2) If the government agrees to purchase any surplus output at $12, how much will it cost the government? (3) If the government buys all of the farmers' output at the floor price, how many bushels of corn will it have to purchase and how much will it cost the government? (4) Suppose the government buys up all of the farmers' output at the floor price and then sells the output to consumers at whatever price it can get. Under this scheme, what is the price at which the government will be able to sell off all of the output it had purchased from farmers? What is the revenue received from the government's sale? (5) In this problem we have considered two government schemes: (1) a price floor is established and the government purchases any excess output and (2) the government buys all the farmers' output at the floor price and resells at whatever price it can get. Which scheme will taxpayers prefer? (6) Consider again the two schemes. Which scheme will corn buyers prefer? ANS (1) 10,000 surplus (2) $12 × 10,000 = $120,000 (3) 28,000 bushels × $12 = $336,000 (4) $6 per bushel and government receives $6 × 28,000 = $168,000 (5) Taxpayers prefer scheme (1) (6) Corn buyers prefer scheme (2) Figure 10 4. Refer to Figure 10 above to solve the following problems. (1) Is it possible to say whether this firm is a perfectly competitive firm or a monopolistically competitive firm? (2) Does the graph show a short-run equilibrium or a long-run equilibrium? Briefly explain. (3) What quantity on the graph represents long-run equilibrium if the firm is perfectly competitive?
