Interaction Plots
For each data set, make an “interaction plot” with level of A on the abscissa, mean score on
ordinate, and one line for each simple main effect of A (at each level of B). Then make a second plot
with B on abscissa and one line for each simple main effect of B. If there is an interaction, write
“monotonic” or “nonmonotonic” above each plot. If there is a main effect of A write “main effect of A”
below the first plot. If there is a main effect of B, write “main effect of B” below the second plot. The
cell entries are means. Assume that you have data for the entire population – in other words, any
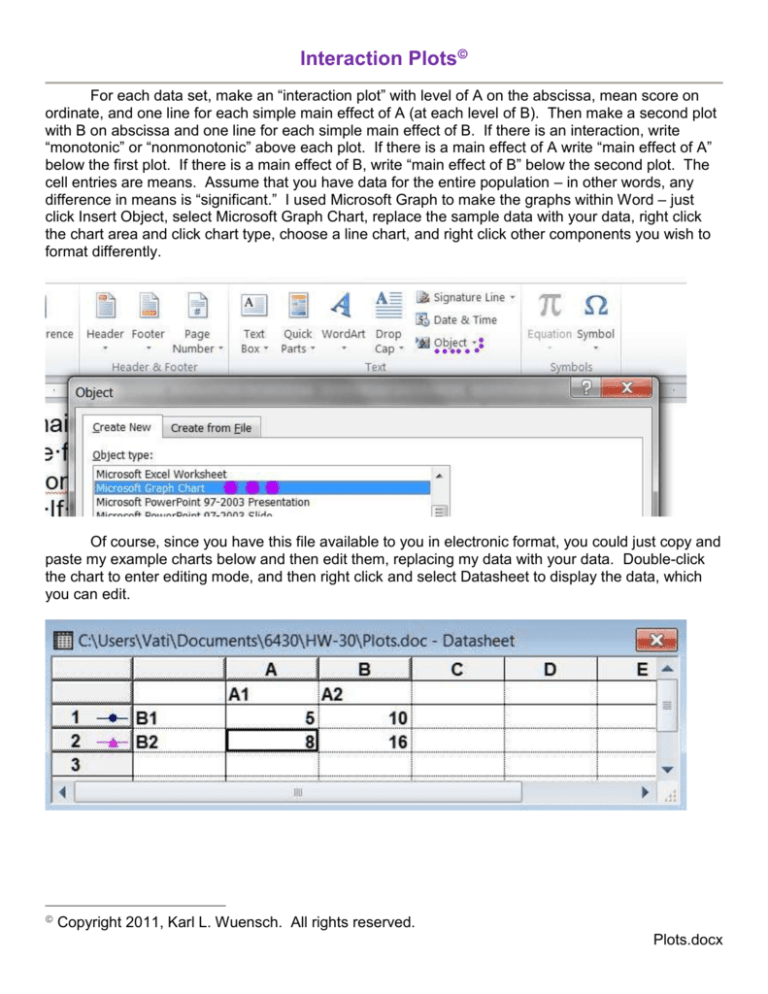
difference in means is “significant.” I used Microsoft Graph to make the graphs within Word – just
click Insert Object, select Microsoft Graph Chart, replace the sample data with your data, right click
the chart area and click chart type, choose a line chart, and right click other components you wish to
format differently.
Of course, since you have this file available to you in electronic format, you could just copy and
paste my example charts below and then edit them, replacing my data with your data. Double-click
the chart to enter editing mode, and then right click and select Datasheet to display the data, which
you can edit.
Copyright 2011, Karl L. Wuensch. All rights reserved.
Plots.docx
2
A
Example
1
2
Marginal
mean
1
5
10
7.5
2
8
16
12.0
6.5
13
In this example, the cell means are
blue and the marginal means are
green. We assume n is constant
across cells, so each marginal
mean is the mean of the cell means
that contribute to it. There are two
levels of Factor A (1 and 2) and two
levels of Factor B (1 and 2).
B
Marginal
Mean
monotonic interaction
18
16
14
12
10
8
6
4
2
0
monotonic interaction
18
16
14
12
10
8
6
4
2
0
B1
B2
A1
A1
A2
A2
B1
main effect of A
B2
main effect of B
You make plots for each of the following 11 data sets
A
#1
1
A
1
2
10
10
B
#2
1
A
1
2
10
20
B
2
10
10
1
1
2
10
20
2
10
20
1
10
20
2
30
40
#5
1
A
1
2
20
30
B
30
2
A
B
2
1
B
A
#4
#3
60
#6
1
2
1
20
40
2
10
50
B
2
10
60
3
A
#7
1
A
1
2
10
50
#8
1
B
A
1
2
#9
20
40
B
2
30
30
1
2
1
30
10
2
50
70
B
2
40
20
A
#10
1
A
1
2
3
10
20
30
B
#11
1
2
3
1
10
30
20
2
30
50
40
B
2
20
30
70
# 12. Three independent variables (A, B, & C) - make an interaction plot with A on abscissa showing
the “simple interaction” between A and B using only those data where C = 1. Make a second
interaction plot between A and B using only those data where C = 2. Answer these questions:
1. Is there a main effect of A if you ignore (collapse across) B and C? (Hint: compare the mean of all
the scores at level 1 of A to the mean of all the scores at level 2 of A.)
2. Is there a main effect of B if you ignore (collapse across) A and C?
3. Is there a main effect of C if you ignore (collapse across) A and B?
4. There is a triple interaction. Describe it and explain how you know there is a triple interaction.
C=1
C=2
A
1
A
1
2
10
20
B
1
2
1
10
30
2
40
40
B
2
30
40
Copyright 2011, Karl L. Wuensch. All rights reserved.

