Name Class Period ______ Date 1.1.1 Review
advertisement
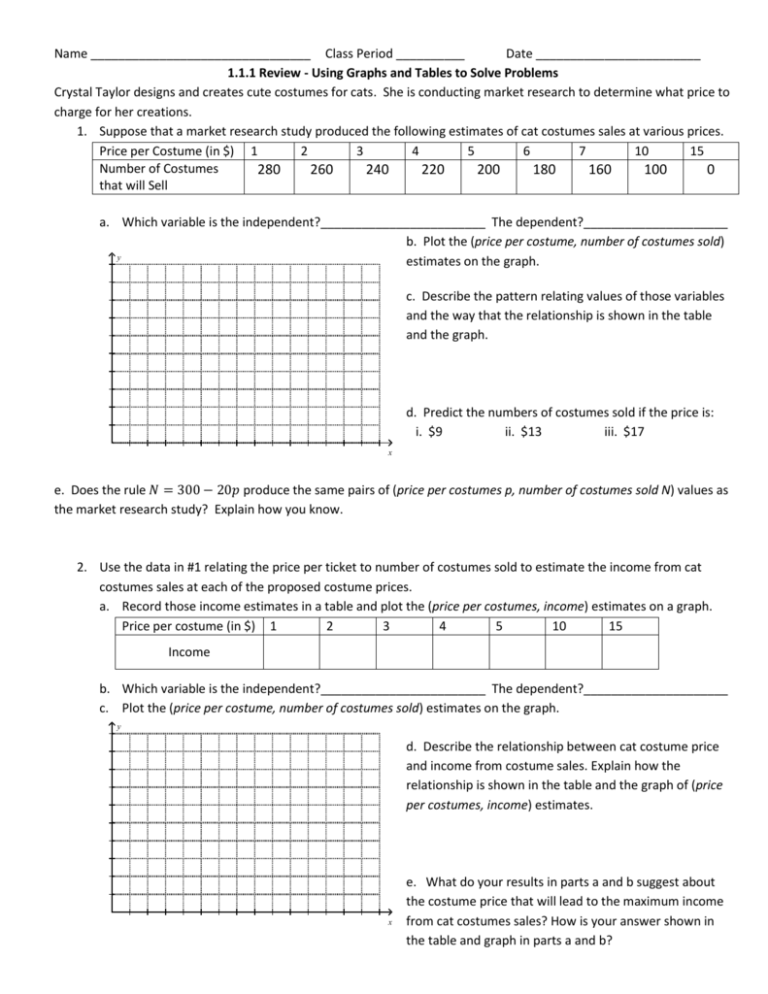
Name ________________________________ Class Period __________ Date ________________________ 1.1.1 Review - Using Graphs and Tables to Solve Problems Crystal Taylor designs and creates cute costumes for cats. She is conducting market research to determine what price to charge for her creations. 1. Suppose that a market research study produced the following estimates of cat costumes sales at various prices. Price per Costume (in $) 1 2 3 4 5 6 7 10 15 Number of Costumes 280 260 240 220 200 180 160 100 0 that will Sell a. Which variable is the independent?________________________ The dependent?_____________________ b. Plot the (price per costume, number of costumes sold) y estimates on the graph. c. Describe the pattern relating values of those variables and the way that the relationship is shown in the table and the graph. d. Predict the numbers of costumes sold if the price is: i. $9 ii. $13 iii. $17 x e. Does the rule 𝑁 = 300 − 20𝑝 produce the same pairs of (price per costumes p, number of costumes sold N) values as the market research study? Explain how you know. 2. Use the data in #1 relating the price per ticket to number of costumes sold to estimate the income from cat costumes sales at each of the proposed costume prices. a. Record those income estimates in a table and plot the (price per costumes, income) estimates on a graph. Price per costume (in $) 1 2 3 4 5 10 15 Income b. Which variable is the independent?________________________ The dependent?_____________________ c. Plot the (price per costume, number of costumes sold) estimates on the graph. y d. Describe the relationship between cat costume price and income from costume sales. Explain how the relationship is shown in the table and the graph of (price per costumes, income) estimates. x e. What do your results in parts a and b suggest about the costume price that will lead to the maximum income from cat costumes sales? How is your answer shown in the table and graph in parts a and b? 3. The Tour de France is the world’s largest annual sporting event starting at the end of June. Cyclists all over the world come to compete in the race. The entire race covers approximately 3,500 kilometers. a. The very first Tour de France occurred in 1903 and was won by Maurice Garin with an average speed of 26 km/hr. How long did it take Garin to finish the race? b. Complete a table to display sample pairs of (average speed, race time) values for completion of the 3,500 km race. Average Speed 15 20 25 30 35 40 45 (in km/hr) Race Time (in hours) c. Plot the sample (average speed, race time) data on a graph. y d. Describe the relationship between the two variables from the graph. e. Write a symbolic rule that shows how to calculate race time t as a function of average speed s in the Tour de France race. f. x Lance Armstrong finished first in 2005 with an average speed of 42 km/hr. Use your rule to calculate Armstrong’s race time. Show your work. 4) Solve the following equations for the indicated variable. a) 3x + 6 = 27 b) 8x + 11 = -61 c) 19 – 2x = 5 d) -38 = 4x – 6 e) 2(3x – 9) = -14 f) -4(5x + 7) = -68 g) 6(5x – 2) + 3 = 21 h) 8x + 16 – 3x = 6
