Unit 3: Modeling with Linear Functions - Test
advertisement
Name:
Date:
Class:
Unit 3: Modeling with Linear Functions - Test
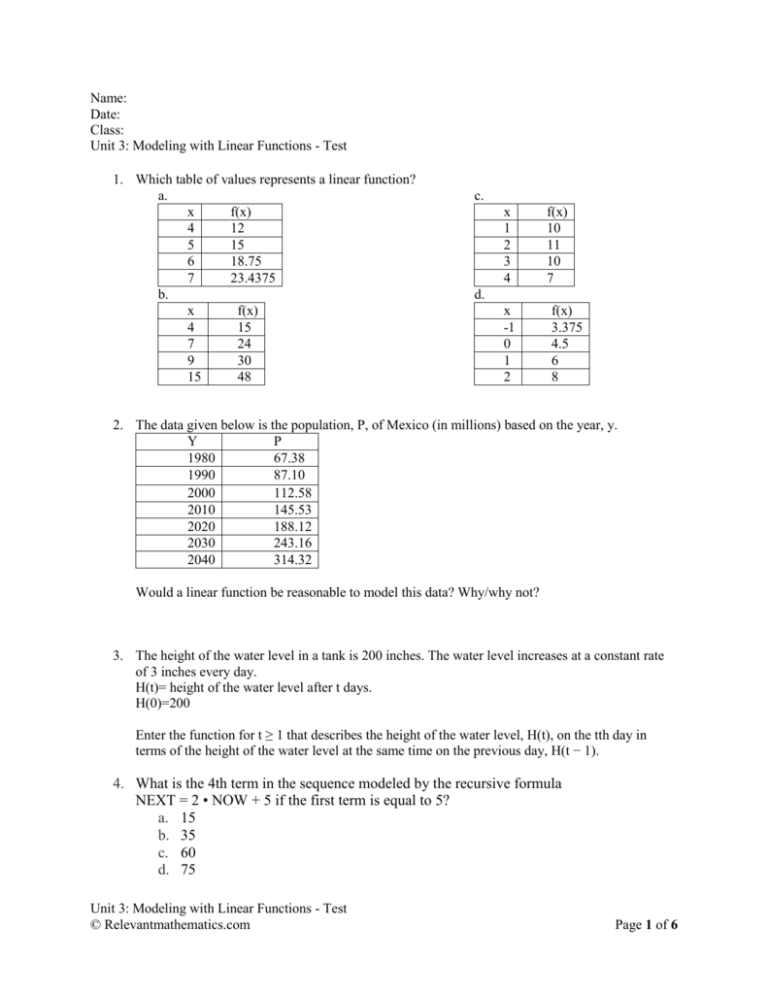
1. Which table of values represents a linear function?
a.
x
f(x)
4
12
5
15
6
18.75
7
23.4375
b.
x
f(x)
4
15
7
24
9
30
15
48
c.
x
1
2
3
4
f(x)
10
11
10
7
d.
x
-1
0
1
2
f(x)
3.375
4.5
6
8
2. The data given below is the population, P, of Mexico (in millions) based on the year, y.
Y
P
1980
67.38
1990
87.10
2000
112.58
2010
145.53
2020
188.12
2030
243.16
2040
314.32
Would a linear function be reasonable to model this data? Why/why not?
3. The height of the water level in a tank is 200 inches. The water level increases at a constant rate
of 3 inches every day.
H(t)= height of the water level after t days.
H(0)=200
Enter the function for t ≥ 1 that describes the height of the water level, H(t), on the tth day in
terms of the height of the water level at the same time on the previous day, H(t − 1).
4. What is the 4th term in the sequence modeled by the recursive formula
NEXT = 2 • NOW + 5 if the first term is equal to 5?
a. 15
b. 35
c. 60
d. 75
Unit 3: Modeling with Linear Functions - Test
© Relevantmathematics.com
Page 1 of 6
5. The sequence follows a “plus 𝟐” pattern: 𝟑, 𝟓, 𝟕, 𝟗, ….
a. Write a formula for the nth term of the sequence. Be sure to specify what value of n your
formula starts with.
b. Using the formula, find the 15th term of the sequence.
c. Graph the terms of the sequence as ordered pairs (n,f(n)) on a coordinate plane.
6. Consider a sequence generated by the formula f(n)= 6n - 4 starting with n=1. Generate
the terms f(1), f(2), f(3), f(4), and f(5).
7. A sequence is defined by the function f(n) = f(n – 1) + 5 where n represents the number
of the term for n ≥ 2 and f(1) = -4. What are the first four terms of the sequence?
8. What sequence does A(n+1)=A(n) - 3 and A(1) = 5 for n ≥ 1 yield?
9. Suppose that g(x) = -1.5x – 1.5
a. Find and equation for h(x) such that h(x) = g(x) – 3
b. Sketch a graph of g(x) and h(x)
Unit 3: Modeling with Linear Functions - Test
© Relevantmathematics.com
Page 2 of 6
10. Lucy and Barbara began saving money the same week. The table below shows the models for the
amount of money Lucy and Barbara had saved after x weeks.
Lucy’s Savings
F(x) = 10x - 5
Barbara’s Savings G(x) = 7.5x + 25
After how many weeks will Lucy and Barbara have the same amount of money saved?
A 1.1 weeks
B 1.7 weeks
C 8 weeks
D 12 weeks
11. The sum of two numbers is 10 and the difference is 6. What are the numbers?
12. Solve the system by substitution, checking your solution by graphing using technology.
-3x + 5y = 6
2x + y = 6
13. Peter examines the coins in the fountain at the mall. He counts 107 coins, all of which are either
pennies or nickels. The total value of the coins is $3.47. How many of each coin did he see?
14. Cell phone Company Y charges a $10 start-up fee plus $0.10 per minute, x. Cell phone Company
Z charges $0.20 per minute, x, with no start-up fee. Which function represents the difference in
cost between Company Y and Company Z?
A f(x) = −0.10x – 10
B f(x) = −0.10x + 10
C f(x) = 10x – 0.10
D f(x) = 10x + 0.10
Unit 3: Modeling with Linear Functions - Test
© Relevantmathematics.com
Page 3 of 6
15. Graph the solution set of the system of linear inequalities:
y > -2/3 x + 5
y ≤ 3x + 1
16. What scenario could be modeled by the graph below?
A The number of pounds of apples, y, minus two times the number of pounds of oranges, x, is at
most 5.
B The number of pounds of apples, y, minus half the number of pounds of oranges, x, is at most
5.
C The number of pounds of apples, y, plus two times the number of pounds of oranges, x, is at
most 5.
D The number of pounds of apples, y, plus half the number of pounds of oranges, x, is at most 5.
17. Graph the line representing the boundary of the linear inequality x + y ≥ 1 and plot a point
representing an ordered pair that is part of the solution set.
𝟏
𝒚 = 𝟒𝒙
18. Solve the system of equations {
by graphing
𝒚 = −𝒙 + 𝟓
Unit 3: Modeling with Linear Functions - Test
© Relevantmathematics.com
Page 4 of 6
19. Write a system of inequalities that represents the shaded region on the graph shown below.
20. A potter is making cups and plates. It takes her 6 min. to make a cup and 3 min. to make a plate.
Each cup uses 3/4 lb. of clay, and each plate uses 1 lb. of clay. She has 20 hr. available to make the cups
and plates and has 250 lb. of clay.
Let c= # of cups made
Let p= # of plates made
Write inequalities to represent the constraints.
Unit 3: Modeling with Linear Functions - Test
© Relevantmathematics.com
Page 5 of 6
Solutions:
1. B
2. No. Rate of change is not really constant. Starts with 20 and ends with 60.
3. H(t ) = H(t – 1) + 3
4. A
5. a. f(n) = 2(n − 1) + 3 starting with n = 1.
b. f(15) = 31
6.
7.
8.
9.
10.
11.
12.
13.
14.
15.
16.
17.
18.
2, 8, 14, 20, 26
-4, 1, 6, 11
5, 2, -1, -4, -7
Solution:
a. h(x) = -1.5x – 4.5
b. https://www.desmos.com/calculator/5mr0gm7pn2
D
X = 8 and y =2
(1.846, 2.308): https://www.desmos.com/calculator/ntkjset8jj
47 pennies and 60 nickels
B
https://www.desmos.com/calculator/xcbik7qbn3
C
https://www.desmos.com/calculator/mxqv80n1wg
(4, 1)
19. {
y ≥ −x + 6
3
4
y ≥ x−3
1
1
3
20. c ≥ 0 and p ≥ 0 and 10 c + 20 p ≤ 20 and 4 c + p ≤ 250
Unit 3: Modeling with Linear Functions - Test
© Relevantmathematics.com
Page 6 of 6

![Bellringer Quiz May 18tha[2]](http://s3.studylib.net/store/data/006592480_1-fb41d0c53b12a24f299a4a7c8b3c022b-300x300.png)
