The Business Case for Solar Photovoltaics
advertisement

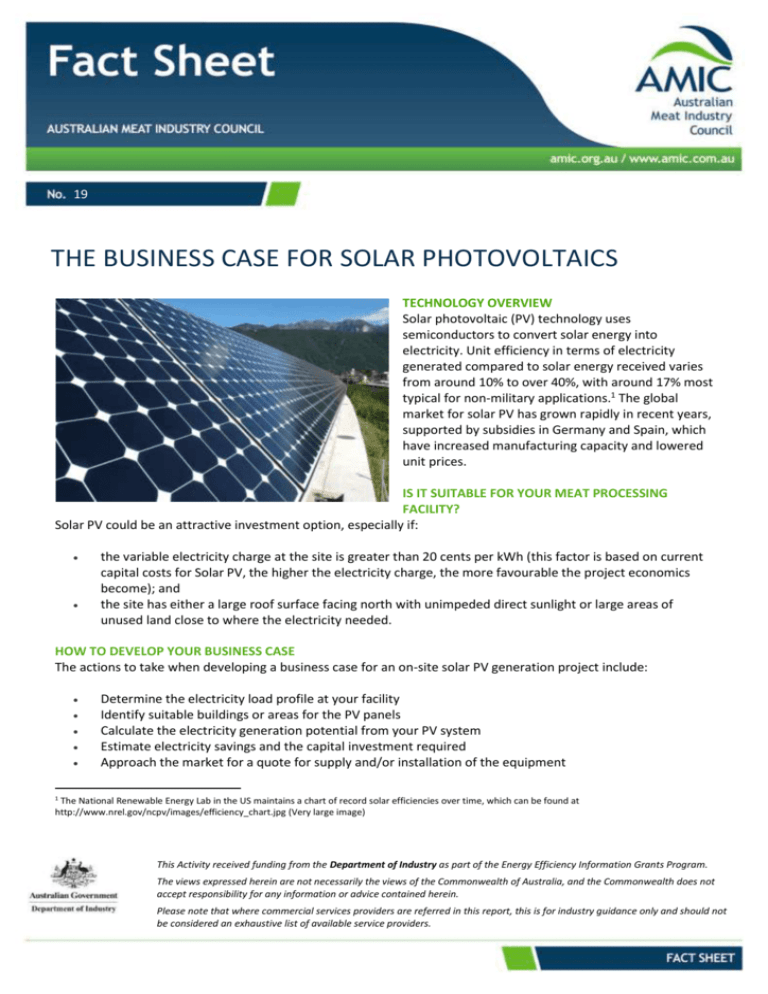
19 THE BUSINESS CASE FOR SOLAR PHOTOVOLTAICS TECHNOLOGY OVERVIEW Solar photovoltaic (PV) technology uses semiconductors to convert solar energy into electricity. Unit efficiency in terms of electricity generated compared to solar energy received varies from around 10% to over 40%, with around 17% most typical for non-military applications.1 The global market for solar PV has grown rapidly in recent years, supported by subsidies in Germany and Spain, which have increased manufacturing capacity and lowered unit prices. IS IT SUITABLE FOR YOUR MEAT PROCESSING FACILITY? Solar PV could be an attractive investment option, especially if: the variable electricity charge at the site is greater than 20 cents per kWh (this factor is based on current capital costs for Solar PV, the higher the electricity charge, the more favourable the project economics become); and the site has either a large roof surface facing north with unimpeded direct sunlight or large areas of unused land close to where the electricity needed. HOW TO DEVELOP YOUR BUSINESS CASE The actions to take when developing a business case for an on-site solar PV generation project include: Determine the electricity load profile at your facility Identify suitable buildings or areas for the PV panels Calculate the electricity generation potential from your PV system Estimate electricity savings and the capital investment required Approach the market for a quote for supply and/or installation of the equipment 1 The National Renewable Energy Lab in the US maintains a chart of record solar efficiencies over time, which can be found at http://www.nrel.gov/ncpv/images/efficiency_chart.jpg (Very large image) This Activity received funding from the Department of Industry as part of the Energy Efficiency Information Grants Program. The views expressed herein are not necessarily the views of the Commonwealth of Australia, and the Commonwealth does not accept responsibility for any information or advice contained herein. Please note that where commercial services providers are referred in this report, this is for industry guidance only and should not be considered an exhaustive list of available service providers. Demand (kW) Peak load DETERMINE THE ELECTRICITY LOAD PROFILE Request your half-hourly interval meter data from your eelctrcity retailer to determine your load profile. You should aim to scale your system to meet daytime base load requirement (see figure 1). Daytime base load Time of day Spring Summer Autumn Winter Figure 1: Illustrative seasonal load profiles Over sizing your PV solar installation can decrease the profitability of the project substantially, due to the difference between the cost of grid electricity and the amount paid for exported electricity.2 It is not recommended to include solar PV as part of a peak load and demand charge reduction strategy. Although in some instances it may be effective in reducing your peak demand, a single cloudy day could result in your peak demand returning to the pre-solar PV profile. This could result in the same demand charges as before. IDENTIFY SUITABLE BUILDINGS OR AREAS FOR THE PV PANELS Assess whether you have a large enough north facing roof surface with unimpeded direct sunlight or unused land close to where you need electricity. As a rule of thumb, you will need 10m2 north facing roof/ground space per kilowatt of solar PV capacity installed. CALCULATE THE ELECTRICITY GENERATION POTENTIAL FROM YOUR PV SYSTEM Use the Clean Energy Regulator’s (CER) “Postcode zones for solar panels” list to determine the typical electricity generating capacity at your location (i.e. MWh of electricity per kWp installed capacity). As an example, a typical flat panel array in NSW generates approximately 1.4 MWh of electricity per kWp installed capacity per annum. Output is seasonal; summer and winter insolation in NSW often varies by 50% or more depending on the location.3 The system output will also vary depending on orientation and tilt angle4 of the solar panels, the presence or absence of shading and ambient temperature. In some circumstances, efficiency can be increased through the use of tracking systems (one or two-axis) which can provide an increase of approximately 10% in efficiency. However, tracking adds significant cost and generally this outweighs the benefit of increased yield. Solar panels 38% 40% Inverters and other components 22% Installation and grid connection Figure 2: Grid connected solar PV - typical upfront system component cost 2 ESTIMATE SAVINGS, INVESTMENT REQUIRED AND FUNDING SOURCES In addition to electricity savings,5 also consider revenue from certificates under the Renewable Energy Target (RET) Scheme as a co-funding source. You can determine whether your project qualifies under the RET Scheme for Small-scale Technology Certificates (STCs) by referring to the CER website.6 Many solar PV retailers will purchase future certificates (for an amount determined by the value of the certificates and the amount of energy the solar PV system will generate) upon selling the system (this is known as ‘deeming’) and reduce the sale price by the corresponding amount. For a full list of feed-in-tariffs across Australia visit www.energymatters.com.au/government-rebates/feedintariff.php#fit-table Go to the Australian Solar Energy Information System (ASEIS) http://www.ga.gov.au/solarmapping/?accept_agreement=on to see the variance in average solar radiation (MJ / day) for your area. 4 The tilt angle of solar panels varies depending on latitude. Solar PV suppliers will model the most appropriate tilt angle for your project however, this is often set by the roof pitch. 5 It is not recommended to include potential changes in demand charges in the payback calculation. 6 http://ret.cleanenergyregulator.gov.au/About-the-Schemes/Small-scale-Renewable-Energy-Scheme--SRES-/about-sres. 3 At present the upfront cost of a roof-mounted grid-connected solar array is approximately $2 per watt7, once STCs are deducted. This does not change much irrespective of whether you are installing a 5kW or 100kW PV system.8 As system size increases, economies of scale apply. However, a reduction in capital costs associated with equipment is offset by increased upfront cost associated with planning, grid connection, network studies and project management fees for larger projects. The intersection of these factors, in addition to load requirements and space, will influence the optimal project size. Most PV panels have a warranted life of 25 years, and inverters typically closer to 10-years, but warranties vary depending on the manufacturer. Solar panel costs continue to fall, although at a slower pace than in recent years. Generally, solar panels constitute less than half the cost of a system as illustrated in Figure 2. Other variables to consider when costing your system include whether the system is grid connected, roof mounted or ground mounted, and whether storage capacity is required and how much. The costs of an off-grid solar PV system tends to be higher due to additional auxiliary equipment such as energy storage systems, as shown in Figure 3. If security of supply is critical, back-up diesel generators may also be required for periods when the solar system does not generate electricity. Ground mounted systems are often about 10% more expensive than roof mounted systems due to the requirement for additional civil engineering works such as concrete footing and piles. Electricity to facility (AC) Grid electricity import PV electricity export PV electricity output (DC) Solar PV Panels Batteries and charge regulator Inverter Abattoir Meter Electricity Grid Figure 3: Schematic of a grid connected PV system with battery storage APPROACH THE MARKET FOR A QUOTE Once you have determined the viability of your project, you should approach the market to quote for the supply and installation of the equipment. The installation and wiring of solar panels must be undertaken by a licensed electrical contractor (or the holder of a qualified supervisor certificate). If the solar installation needs to be connected to the electricity distribution network, contact your network provider to determine connection requirements. Generally the installer can install the panels and inverter, but the network provider is required for the connection to the grid. 7 http://www.businessspectator.com.au/article/2013/11/14/solar-energy/solar-pv-price-check-%E2%80%93-november. For example, the average price per kW for a 5kW system in Sydney, excluding government incentives, is approximately $2,300. STCs typically accounted for a discount of about $680 per kW for the Zone 3 cities such as Sydney. Retrieved on 1 October 2013 from: http://www.solarchoice.net.au/blog/solar-pvprice-index-september-2013/ ; Also see other system price estimates at http://www.solarchoice.net.au/blog/30kw-commercial-solar-power-installationsand-solar-farms-price-output-returns/ and https://www.standardsolar.com.au/new-solar-systems/100kw-solar-system. 8 If you wish to claim any State or Federal Government rebates, including STCs for the installation of solar panels, you should ensure the installer you use is accredited by the Clean Energy Council (CEC). A list of accredited installers is available on the CEC website (www.cleanenergycouncil.org.au). Every installation carried out by an accredited installer is required to meet the Australian Standards for installation9 and products. The Clean Energy Council has compiled a list of approved products - including solar PV modules (panels) and grid-connect inverters that meet these standards that can be accessed at www.solaraccreditation.com.au/approvedproducts. EXAMPLE COST-BENEFIT ANALYSIS Following is a simple example CBA based on high-level assumptions about site energy use. More detailed energy use data will better inform your decision, particularly when considering the proportion of electricity which is used during the day. Best-practice would be to use a model based on usage data, which compares potential generation with use, and determines the most appropriate size by maximising on-site energy use. A more simplistic determination can be made based on the assumptions listed in Table 1. The average daytime electrical load for each season can be calculated using the formula below, with the results presented in the last column of the table. The consumption figure should be taken from your electricity bills or be provided by your electricity retailer. The percentage of daytime use is typical for commercial installations and will change extensively for businesses which operate continuously, which could lead to daytime electricity use closer to 50% or 60% of total electricity use. The daytime hours estimate could be shaped to reflect seasonal variance, using data from the Bureau of Meteorology, but assuming 12-hours year round is satisfactory. The difference between summer and winter day-length decreases further north in Australia. Daytime electrical load (kW) = (Electricity consumption (kWh) x percentage energy use in daytime) / daytime hours / days in season Season Summer Autumn Winter Spring Total Consumption (kWh) 165,600 136,500 150,150 163,800 616,050 % of electricity use in daytime 80% 80% 80% 80% Daytime hours (6 am and 6 pm) 12 12 12 12 Days 92 91 91 91 365 Daytime electrical load (kW) 120 100 110 120 Table 1: Key assumptions Based on the seasonable variability of the load at the example site detailed in Table 1, a 100kW solar PV system is recommended (i.e. 80% of the spring daytime load). This is a very conservative estimate that ensures onsite use is maximised, but larger systems could be favourable given more detailed calculations. You will need to assess whether there is enough space to install this system. Suitable space required (m^2 )=100kW ×10 m^2 per kW =1000 m^2 Then calculate the electricity generation potential from your PV system, assuming the site is located in ‘Zone 3’10 with an electricity generating potential of 1.4 MWh per kW capacity (see Clean Energy Regulator postal code list). Electricity generation potential (MWh)=1.4 MWh x 100=140 MWh 9 AS4777 Grid-connections of energy systems via inverters, AS/NZS 3000 Electrical wiring rules, AS1768 Lightning protection, AS/NZS 1170.2 Wind loads and AS/NZS 5033 Installation of photovoltaic (PV) arrays 10 Refer Clean Energy Regulator website for more information http://ret.cleanenergyregulator.gov.au/Forms-and-Publications/Publications/calculations_stc Assuming the price paid for electricity is $0.25/kWh, the annual energy savings of $35,000 are anticipated (i.e. 140MWh x $250/MWh). At an STC value of $680 per kW or $68,000 for this system, the payback period is reduced by two years. The value of STCs is typically discounted at the point of sale. A preliminary assessment of the financial viability of a standard grid connected roof mounted solar PV installation is presented Table 2. These calculations do not account for future energy price increases and assumes no financing costs. It is further assumed that 100% of the energy is used to displace facility electricity use. A potential reduction in peak demand changes are not included, for reasons stated in the previous section. PV system capacity Upfront cost ($) Upfront cost / W installed Annual electricity production (MWh) Simple payback on standard installation without incentive Payback with existing incentives (i.e. STCs) 100kW $220,000 $2.20 140 6.3 years 4.3 years Table 2: Illustrative simple payback


