Titanic Tragedy II
advertisement
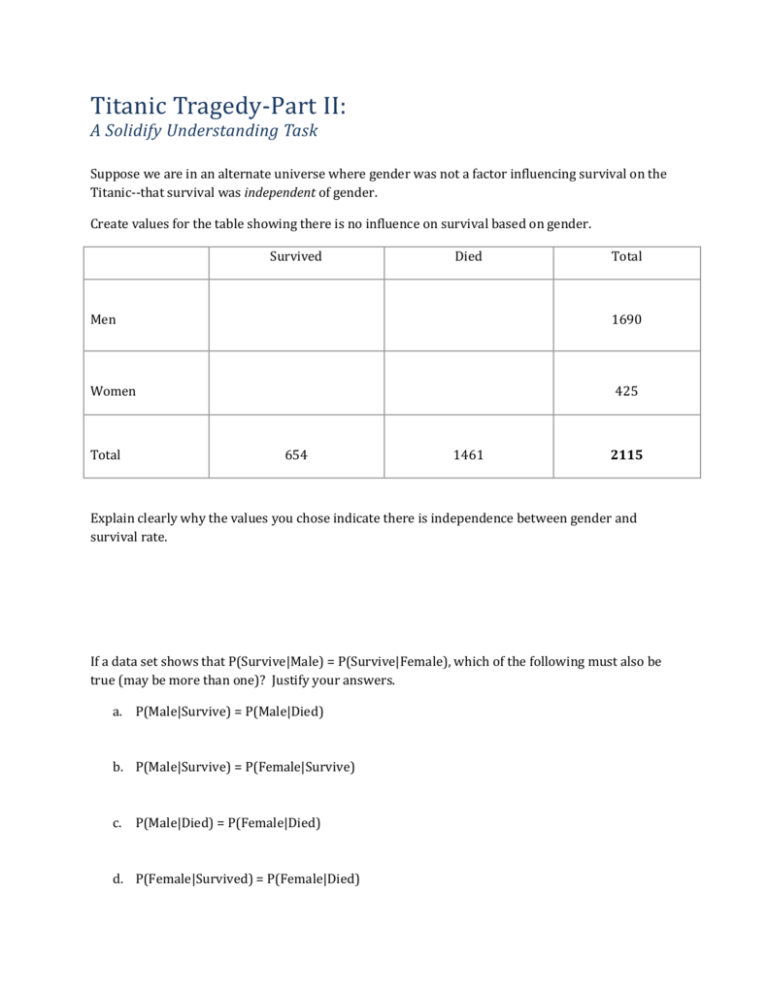
Titanic Tragedy-Part II: A Solidify Understanding Task Suppose we are in an alternate universe where gender was not a factor influencing survival on the Titanic--that survival was independent of gender. Create values for the table showing there is no influence on survival based on gender. Survived Died Total Men 1690 Women 425 Total 654 1461 2115 Explain clearly why the values you chose indicate there is independence between gender and survival rate. If a data set shows that P(Survive|Male) = P(Survive|Female), which of the following must also be true (may be more than one)? Justify your answers. a. P(Male|Survive) = P(Male|Died) b. P(Male|Survive) = P(Female|Survive) c. P(Male|Died) = P(Female|Died) d. P(Female|Survived) = P(Female|Died) Titanic Tragedy-Part II: – Teacher Notes A Solidify Understanding Task Purpose: To solidify understanding of the concept of statistical independence and how it appears in a 2-way data table, and how it is expressed in formal probability notation. Core Standards Focus: S.CP.3: Understand the conditional probability of A given B as P(A and B)/P(B), and interpret independence of A and B as saying that the conditional probability of A given B is the same as the probability of A, and the conditional probability of B given A is the same as the probability of B. Related Standards: S.CP.2, S.CP.4 Launch (Whole Class): This task closely follows Titanic Tragedy Part I and is best used in conversation with it. If used on a separate day, then refresh the students with the key findings from Part I (that gender and survival are not independent) to inquire what the data would have looked like if those variables were independent. Keep this brief and let them work out their ideas on the Part II task. Explore (Small Group): ● ● ● Participants should fill out the table with numbers that they have determined would indicate that gender has no effect on survival rate. They may struggle to find values to fill in the table that show independence between gender and survival rate, but encourage them to create values that are reasonable. Note that there are thousands of ways for the data to show dependence, but only one way that shows independence (with a small bit of rounding). The correct solution is when the overall survival rate is equal to the survival rates of both men and women. Participants may try to guess and check or may show proportional arguments. If participants are stumped, prompt them to use the overall survival rate. Discuss (Whole Class): 1. Formalize the proportionality relationship of independent events with the probability equation, P(A)=P(A|B) [i.e., P(Survive) = P(Survive|Female)=P(Survive|Male)] 2. As in Part I, have them explicitly write out the following values for their numbers P(Survive) = P(Survive|Male) = P(Survive|Female)= Why are these probabilities equal? 3. Have participants formalize a definition of independence both in a sentence and using probability notation. 4. The focus of this task is the equation and definition for independent events. Additional probability equations such as: Conditional Probability: P(A|B) = P(A and B) / P(B), Joint Probability: P(A and B) = P(A)P(B), or the General Multiplication Rule: P(A and B) = P(A)P(B|A) = P(B)P(B|A), may come up but are not the focus of this task. 5. Extension or Assessment: Use an additional scenario like Screaming and Throwing, and/or have the class work on the following: Create a two-way data table for the following scenario that shows the variables to be independent: 900 men and 350 women were asked which sport they preferred to play, basketball or soccer. 24% of the sample said they liked to play neither sport. Of the group of men that had a preference, 439 declared their preference for soccer. KEY Men Women TOTAL Soccer 439 171 610 Basketball 245 95 340 Neither 216 84 300 TOTAL 900 350 1250

