Electricity Report 1 - 7 February 2015
advertisement
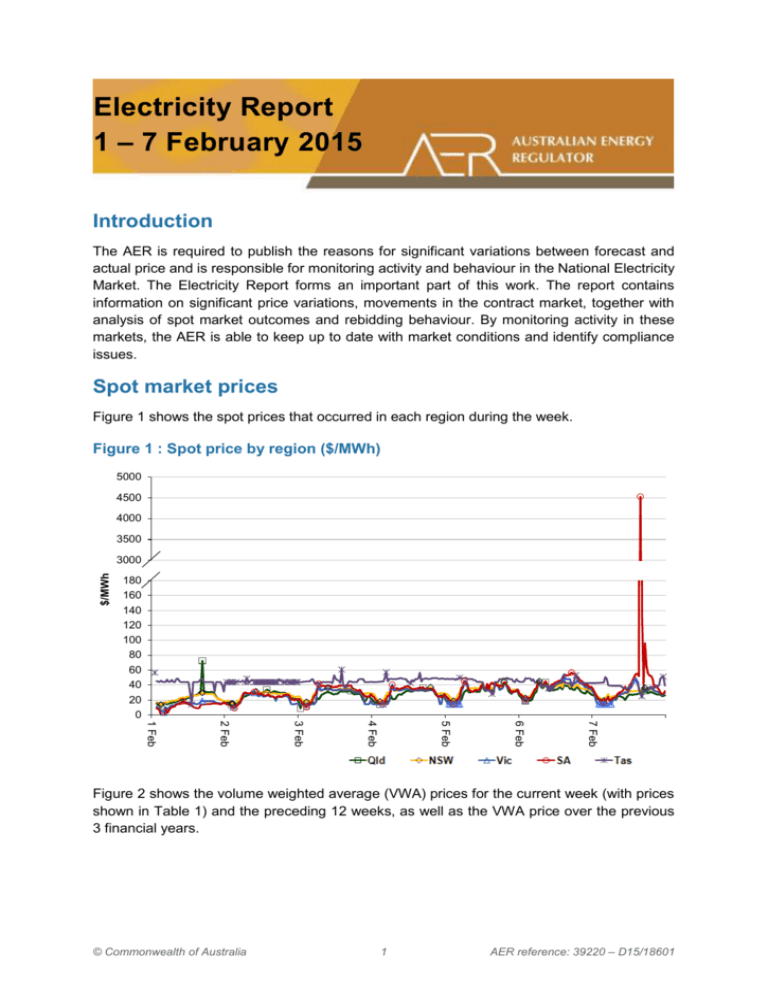
Electricity Report 1 – 7 February 2015 Introduction The AER is required to publish the reasons for significant variations between forecast and actual price and is responsible for monitoring activity and behaviour in the National Electricity Market. The Electricity Report forms an important part of this work. The report contains information on significant price variations, movements in the contract market, together with analysis of spot market outcomes and rebidding behaviour. By monitoring activity in these markets, the AER is able to keep up to date with market conditions and identify compliance issues. Spot market prices Figure 1 shows the spot prices that occurred in each region during the week. Figure 1 : Spot price by region ($/MWh) 5000 4500 4000 3500 $/MWh 3000 180 160 140 120 100 80 60 40 20 0 7 Feb 6 Feb 5 Feb 4 Feb 3 Feb 2 Feb 1 Feb Figure 2 shows the volume weighted average (VWA) prices for the current week (with prices shown in Table 1) and the preceding 12 weeks, as well as the VWA price over the previous 3 financial years. © Commonwealth of Australia 1 AER reference: 39220 – D15/18601 Figure 2 : Volume weighted average spot price by region ($/MWh) 400 350 300 $/MWh 250 200 150 100 50 0 Current week Previous week Tas 18 Jan 11 Jan SA 4 Jan Vic 28 Dec 21 Dec NSW 14 Dec 7 Dec 30 Nov 23 Nov 16 Nov 9 Nov 13/14 FY 12/13 FY 11/12 FY Qld Table 1 : Volume weighted average spot prices by region ($/MWh) Region Qld NSW Vic SA Tas Current week 27 30 28 52 44 13-14 financial YTD 61 53 54 68 42 14-15 financial YTD 62 37 32 40 38 Longer-term statistics tracking average spot market prices are available on the AER website. Spot market price forecast variations The AER is required under the National Electricity Rules to determine whether there is a significant variation between the forecast spot price published by the Australian Energy Market Operator (AEMO) and the actual spot price and, if there is a variation, state why the AER considers the significant price variation occurred. It is not unusual for there to be significant variations as demand forecasts vary and participants react to changing market conditions. A key focus is whether the actual price differs significantly from the forecast price either four or 12 hours ahead. These timeframes have been chosen as indicative of the time frames within which different technology types may be able to commit (intermediate plant within four hours and slow start plant within 12 hours). There were 47 trading intervals throughout the week where actual prices varied significantly from forecasts. This compares to the weekly average in 2014 of 71 counts and the average in 2013 of 97. Reasons for the variations for this week are summarised in Table 2. Based on AER analysis, the table summarises (as a percentage) the number of times when the actual price differs significantly from the forecast price four or 12 hours ahead and the major reason for that variation. The reasons are classified as availability (which means that there is a change in the total quantity or price offered for generation), demand forecast inaccuracy, changes to network capability or as a combination of factors (when there is not one dominant reason). An instance where both four and 12 hour ahead forecasts differ significantly from the actual price will be counted as two variations. 2 AER reference: 39220 – D15/18601 Table 2 : Reasons for variations between forecast and actual prices Availability Demand Network Combination % of total above forecast 3 32 5 0 % of total below forecast 42 16 0 3 Note: Due to rounding, the total may not be 100 per cent. Generation and bidding patterns The AER reviews generator bidding as part of its market monitoring to better understand the drivers behind price variations. Figure 3 to Figure 7 show the total generation dispatched and the amounts of capacity offered within certain price bands for each 30 minute trading interval in each region. Figure 3 : Queensland generation and bidding patterns 12000 10000 MW 8000 6000 4000 2000 0 12 noon - 7 Feb 3 12 noon - 6 Feb $0/MWh to $50/MWh $500/MWh to $5000/MWh 12 noon - 5 Feb 12 noon - 4 Feb 12 noon - 3 Feb 12 noon - 2 Feb 12 noon - 1 Feb <$0/MWh $100/MWh to $500/MWh Total generation (MW) $50/MWh to $100/MWh Above $5000/MWh AER reference: 39220 – D15/18601 Figure 4 : New South Wales generation and bidding patterns 16000 14000 12000 MW 10000 8000 6000 4000 2000 0 $0/MWh to $50/MWh $500/MWh to $5000/MWh 12 noon - 7 Feb 12 noon - 6 Feb 12 noon - 5 Feb 12 noon - 4 Feb 12 noon - 3 Feb 12 noon - 2 Feb 12 noon - 1 Feb <$0/MWh $100/MWh to $500/MWh Total generation (MW) $50/MWh to $100/MWh Above $5000/MWh Figure 5 : Victoria generation and bidding patterns 12000 10000 MW 8000 6000 4000 2000 0 12 noon - 7 Feb 4 12 noon - 6 Feb $0/MWh to $50/MWh $500/MWh to $5000/MWh 12 noon - 5 Feb 12 noon - 4 Feb 12 noon - 3 Feb 12 noon - 2 Feb 12 noon - 1 Feb <$0/MWh $100/MWh to $500/MWh Total generation (MW) $50/MWh to $100/MWh Above $5000/MWh AER reference: 39220 – D15/18601 Figure 6: South Australia generation and bidding patterns 3500 3000 2500 MW 2000 1500 1000 500 0 12 noon - 7 Feb $0/MWh to $50/MWh $500/MWh to $5000/MWh 12 noon - 6 Feb 12 noon - 5 Feb 12 noon - 4 Feb 12 noon - 3 Feb 12 noon - 2 Feb 12 noon - 1 Feb <$0/MWh $100/MWh to $500/MWh Total generation (MW) $50/MWh to $100/MWh Above $5000/MWh Figure 7: Tasmania generation and bidding patterns 2500 2000 MW 1500 1000 500 0 12 noon - 7 Feb 5 12 noon - 6 Feb $0/MWh to $50/MWh $500/MWh to $5000/MWh 12 noon - 5 Feb 12 noon - 4 Feb 12 noon - 3 Feb 12 noon - 2 Feb 12 noon - 1 Feb <$0/MWh $100/MWh to $500/MWh Total generation (MW) $50/MWh to $100/MWh Above $5000/MWh AER reference: 39220 – D15/18601 Frequency control ancillary services markets Frequency control ancillary services (FCAS) are required to maintain the frequency of the power system within the frequency operating standards. Raise and lower regulation services are used to address small fluctuations in frequency, while raise and lower contingency services are used to address larger frequency deviations. There are six contingency services: fast services, which arrest a frequency deviation within the first 6 seconds of a contingent event (raise and lower 6 second) slow services, which stabilise frequency deviations within 60 seconds of the event (raise and lower 60 second) delayed services, which return the frequency to the normal operating band within 5 minutes (raise and lower 5 minute) at which time the five minute dispatch process will take effect. The Electricity Rules stipulate that generators pay for raise contingency services and customers pay for lower contingency services. Regulation services are paid for on a “causer pays” basis determined every four weeks by AEMO. The total cost of FCAS on the mainland for the week was $1 327 000 or around 1.3 per cent of energy turnover on the mainland. The total cost of FCAS in Tasmania for the week was $75 000 or less than 1 per cent of energy turnover in Tasmania. Figure 8 : Daily frequency control ancillary service cost 1 200 000 1 000 000 800 000 $ 600 000 400 000 200 000 0 7 Feb Raise 5min Lower 5min 6 Feb 5 Feb Raise 60sec Lower 60sec 4 Feb 3 Feb 2 Feb 1 Feb Average cost Raise 6sec Lower 6sec Raise Reg Lower Reg Figure 8 shows the daily breakdown of cost for each FCAS for the NEM, as well as the average cost since the beginning of the previous financial year. On 7 February, the requirement for lower regulation services increased significantly in South Australia following the unplanned outage of the Alcoa Portland–Heywood–Tarrone no.1 500 kV transmission line and the Alcoa Portland no.3 500 kV bus. The price for lower 5 minute services reached $9000/MW at 3.40 pm and 3.45 pm. The price for lower 60 second services reached $13 100/MW at 3.40 pm, 3.45 pm, and 3.50 pm. The price for the lower 6 second services 6 AER reference: 39220 – D15/18601 reached $13 100/MW at 3.40 pm and 3.45 pm. Overall the cost of lower FCAS in South Australia exceeded $1 000 000. This is described further in the ‘Detailed market analysis of significant price events’ section. Detailed market analysis of significant price events We provide more detailed analysis of events where the spot price was greater than three times the weekly average price in a region and above $250/MWh or was below -$100/MWh. South Australia There was one occasion where the spot price in South Australia was greater than three times the South Australia weekly average price of $52/MWh and above $250/MWh. South Australia - Saturday, 7 February Table 3 : Price, Demand and Availability Time 4 PM Price ($/MWh) Demand (MW) Availability (MW) Actual 4 hr forecast 12 hr forecast Actual 4 hr forecast 12 hr forecast Actual 4 hr forecast 12 hr forecast 4526.63 45.99 44.97 2125 2163 2122 2787 2935 3038 Demand was close to forecast. Available generation was 148 MW lower than forecast four hours before. At 3.19 pm, the Alcoa Portland–Heywood–Tarrone no.1 500 kV transmission line and the Alcoa Portland no.3 500 kV bus tripped. AEMO invoked a number of constraints at 3.35 pm to manage the outages. The constraints affected the Heywood and Murraylink interconnectors and lower FCAS requirements in South Australia. At 3.40 pm in response to the constraints, the Heywood interconnector switched from importing 275 MW into South Australia, to exporting 250 MW into Victoria (a 525 MW change). However, the step change across Heywood was not enough to meet the constraint requirements causing the constraints to violate at 3.40 pm and 3.45 pm. With low-priced capacity either ramp rate limited, fully dispatched or stranded in FCAS, the dispatch price reached the price cap at 3.40 pm and 3.45 pm. The above conditions led to an increase in the requirement for lower FCAS in South Australia. This resulted in high FCAS prices, as detailed in the ‘Frequency control ancillary services markets’ section. There was no significant rebidding. Financial markets Figure 9 shows for all mainland regions the prices for base contracts (and total traded quantities for the week) for each quarter for the next four financial years. 7 AER reference: 39220 – D15/18601 120 900 100 750 80 600 60 450 40 300 20 150 0 Number of contracts traded $/MWh Figure 9 : Quarterly base future prices Q1 2015 – Q4 2018 0 Q4 2018 Q3 2018 Vic volume Vic Q2 2018 Q1 2018 Q4 2017 Q3 2017 NSW volume NSW Q2 2017 Q1 2017 Q4 2016 Q3 2016 Q2 2016 Q1 2016 Q4 2015 Q3 2015 Q2 2015 Q1 2015 Qld volume Qld SA volume SA Source: ASXEnergy.com.au Figure 10 shows how the price for each regional Quarter 1 2015 base contract has changed over the last 10 weeks (as well as the total number of trades each week). The closing quarter 1 2013 and quarter 1 2014 prices are also shown. The AER notes that data for South Australia is less reliable due to very low numbers of trades. 120 600 100 500 80 400 60 300 40 200 20 100 0 Number of contracts traded $/MWh Figure 10 : Price of Q1 2015 base contracts over the past 10 weeks (and the past 2 years) 0 Current 25 Jan Vic volume Vic 18 Jan 11 Jan NSW volume NSW 04 Jan 28 Dec 21 Dec 14 Dec 07 Dec 30 Nov Q1 2014 Q1 2013 Qld volume Qld SA volume SA Note: Base contract prices are shown for each of the current week and the previous 9 weeks, with average prices shown for yearly periods 1 and 2 years prior to the current year Source: ASXEnergy.com.au Prices of other financial products (including longer-term price trends) are available in the Industry Statistics section of our website. 8 AER reference: 39220 – D15/18601 Figure 11Figure 11 : Price of Q1 2015 cap contracts over the past 10 weeks (and the past 2 years) shows how the price for each regional Quarter 1 2015 cap contract has changed over the last 10 weeks (as well as the total number of trades each week). The closing quarter 1 2013 and quarter 1 2014 prices are also shown. 45 450 40 400 35 350 30 300 25 250 20 200 15 150 10 100 5 50 0 0 Current 25 Jan Vic volume Vic 18 Jan 11 Jan NSW volume NSW 04 Jan 28 Dec 21 Dec 14 Dec 07 Dec 30 Nov Q1 2014 Q1 2013 Qld volume Qld Number of contracts traded $/MWh Figure 11 : Price of Q1 2015 cap contracts over the past 10 weeks (and the past 2 years) SA volume SA Source: ASXEnergy.com.au Australian Energy Regulator February 2015 9 AER reference: 39220 – D15/18601
