docx - FPsc
advertisement
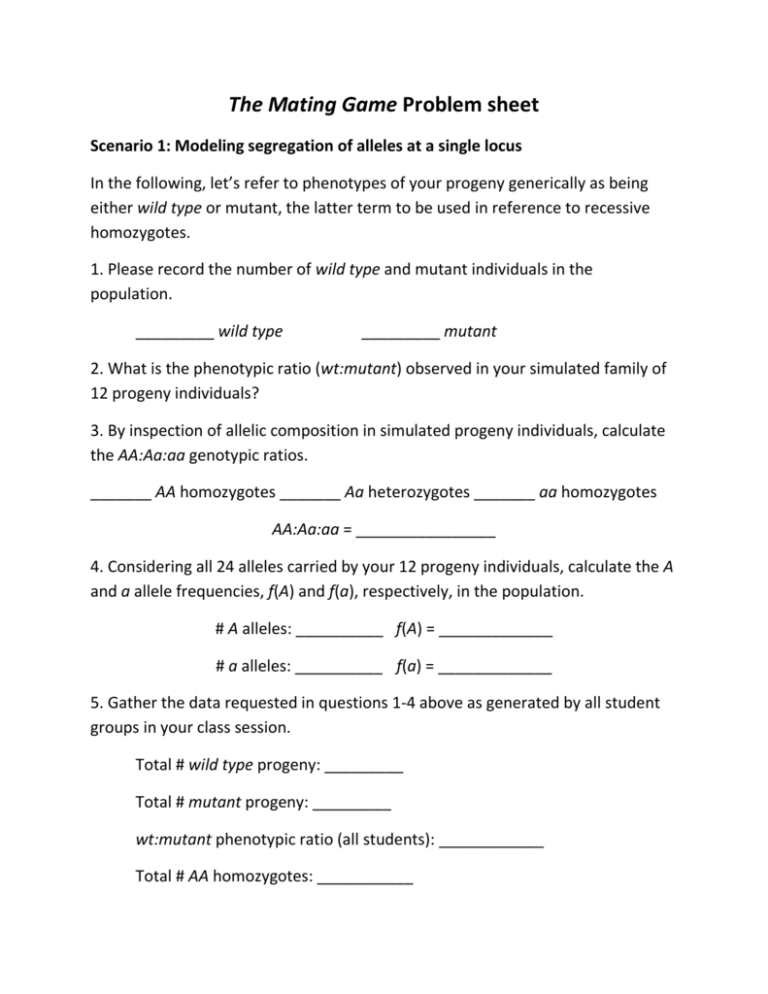
The Mating Game Problem sheet Scenario 1: Modeling segregation of alleles at a single locus In the following, let’s refer to phenotypes of your progeny generically as being either wild type or mutant, the latter term to be used in reference to recessive homozygotes. 1. Please record the number of wild type and mutant individuals in the population. _________ wild type _________ mutant 2. What is the phenotypic ratio (wt:mutant) observed in your simulated family of 12 progeny individuals? 3. By inspection of allelic composition in simulated progeny individuals, calculate the AA:Aa:aa genotypic ratios. _______ AA homozygotes _______ Aa heterozygotes _______ aa homozygotes AA:Aa:aa = ________________ 4. Considering all 24 alleles carried by your 12 progeny individuals, calculate the A and a allele frequencies, f(A) and f(a), respectively, in the population. # A alleles: __________ f(A) = _____________ # a alleles: __________ f(a) = _____________ 5. Gather the data requested in questions 1-4 above as generated by all student groups in your class session. Total # wild type progeny: _________ Total # mutant progeny: _________ wt:mutant phenotypic ratio (all students): ____________ Total # AA homozygotes: ___________ Total # Aa heterozygotes: ___________ Total # aa homozygotes: ___________ AA:Aa:aa genotypic ratios (all students): ___________ Total # A alleles among all progeny families: __________ Total # a alleles among all progeny families: __________ f(A) (all data): __________ f(a) (all data): __________ Variation on scenario 1: Removal of deleterious genotypes from the population by selection. 6. Having removed all infertile albino progeny segregants from your population and replaced them by copying the genotypes and phenotypes of the nearest flanking wt segregants, repeat the calculations of question 5, above. Your teacher will instruct you whether to use just the data from your population or to aggregate data from all student teams. # wild type progeny: _________ # mutant progeny: _________ wt:mutant phenotypic ratio: ____________ # AA homozygotes: ___________ # Aa heterozygotes: ___________ # aa homozygotes: ___________ AA:Aa:aa genotypic ratios: ___________ # A alleles among all progeny: __________ # a alleles among all progeny: __________ f(A) (all data): __________ f(a) (all data): __________ 7. Imagine that this scenario was to play-out over many successive generations. Starting from an initial population in which f(A) and f(a) were both 0.5, sketch a plot below that indicates the change in values you would expect over the course of many successive generations of growth and reproduction. Please use a solid line to plot f(A) and a dashed line to indicate f(a) and be sure to label axes and plots. 8. Examine the “alleles” remaining in the gene pool container and roughly compare the relative numbers of A and a alleles. Keeping in mind your response to question 7, please predict how, if ever, the a allele frequency (f(a)) would ever reach 0.0—that is, be eliminated from the population. Scenario 2: Modeling segregation and independent assortment of alleles at a two genetically unlinked loci Your instructor will have asked you to model segregation of alternative alleles at two different loci in this version of The Mating Game. Once you and your fellow students have generated 12 progeny individuals as instructed, record your results using the table below. For phenotype predictions you can simply use single letter (upper or lower case) designations as you complete the table shown below (consider this question 9 in the problem sheet). Progeny # Genotype at locus 1 Genotype at locus2 Phenotype due to alleles at locus 1 Phenotype due to alleles at locus 2 1 2 3 4 5 6 7 8 9 10 11 12 Table 1: Genotypic and phenotypic outcomes among progeny produced in the two-locus model.
