ggge20136-sup-0005-suppinfo05
advertisement
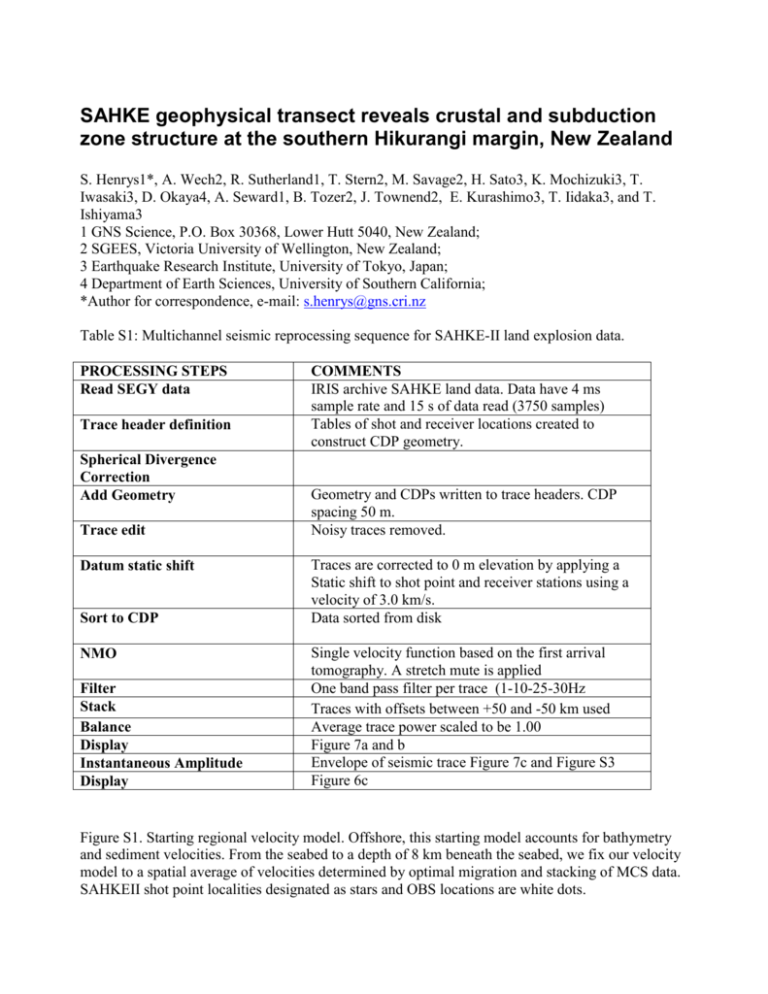
SAHKE geophysical transect reveals crustal and subduction zone structure at the southern Hikurangi margin, New Zealand S. Henrys1*, A. Wech2, R. Sutherland1, T. Stern2, M. Savage2, H. Sato3, K. Mochizuki3, T. Iwasaki3, D. Okaya4, A. Seward1, B. Tozer2, J. Townend2, E. Kurashimo3, T. Iidaka3, and T. Ishiyama3 1 GNS Science, P.O. Box 30368, Lower Hutt 5040, New Zealand; 2 SGEES, Victoria University of Wellington, New Zealand; 3 Earthquake Research Institute, University of Tokyo, Japan; 4 Department of Earth Sciences, University of Southern California; *Author for correspondence, e-mail: s.henrys@gns.cri.nz Table S1: Multichannel seismic reprocessing sequence for SAHKE-II land explosion data. PROCESSING STEPS Read SEGY data Trace header definition Spherical Divergence Correction Add Geometry Trace edit Datum static shift Sort to CDP NMO Filter Stack Balance Display Instantaneous Amplitude Display COMMENTS IRIS archive SAHKE land data. Data have 4 ms sample rate and 15 s of data read (3750 samples) Tables of shot and receiver locations created to construct CDP geometry. Geometry and CDPs written to trace headers. CDP spacing 50 m. Noisy traces removed. Traces are corrected to 0 m elevation by applying a Static shift to shot point and receiver stations using a velocity of 3.0 km/s. Data sorted from disk Single velocity function based on the first arrival tomography. A stretch mute is applied One band pass filter per trace (1-10-25-30Hz Traces with offsets between +50 and -50 km used Average trace power scaled to be 1.00 Figure 7a and b Envelope of seismic trace Figure 7c and Figure S3 Figure 6c Figure S1. Starting regional velocity model. Offshore, this starting model accounts for bathymetry and sediment velocities. From the seabed to a depth of 8 km beneath the seabed, we fix our velocity model to a spatial average of velocities determined by optimal migration and stacking of MCS data. SAHKEII shot point localities designated as stars and OBS locations are white dots. Figure S2. (a) Rays traced on the final first-arrival tomography model. Only every 4th ray is plotted. (b) Grid of derivative weight sum (DWS). The DWS weights each ray path length according to its spatial separation from the grid node. Larger DWS values indicate better data coverage. SAHKE-II shot point localities designated as stars and OBS locations are white dots. Figure S3. Wide-angle CDP stacked images of individual SAHKE-II onshore shots with instantaneous amplitude processing step applied and superimposed on the two-way time converted velocity model shown in Figure 3d; (a) SHOT 12, (b) SHOT 11, (c) SHOTS 9 and 1. The prominent lower crustal reflection, PintP, at the base of pronounced reflectivity, is from the top of the subducted Pacific plate. Crustal reflection, PcP, appears as the top of underplated material and is interpreted as the Wairarapa Fault (A). Other splay faults (B and C) branch from where the plate interface steps down and increases in dip from <5° to >15°, ~100 km away from the trench. Details of the processing sequence are given in Table S1. Figure S4. Enlarged version of Figure 3e. Marine MCS (SAHKE01, SAHKE02, low-fold SAHKEII onshore shots) data with the two-way-travel-time (twt) converted velocity model superimposed. Picked horizons and faults are shown in black and dashed where uncertain. The interpretation beneath the central section is from the low fold stack of land explosions (see Figure 7).

