Chap3
advertisement
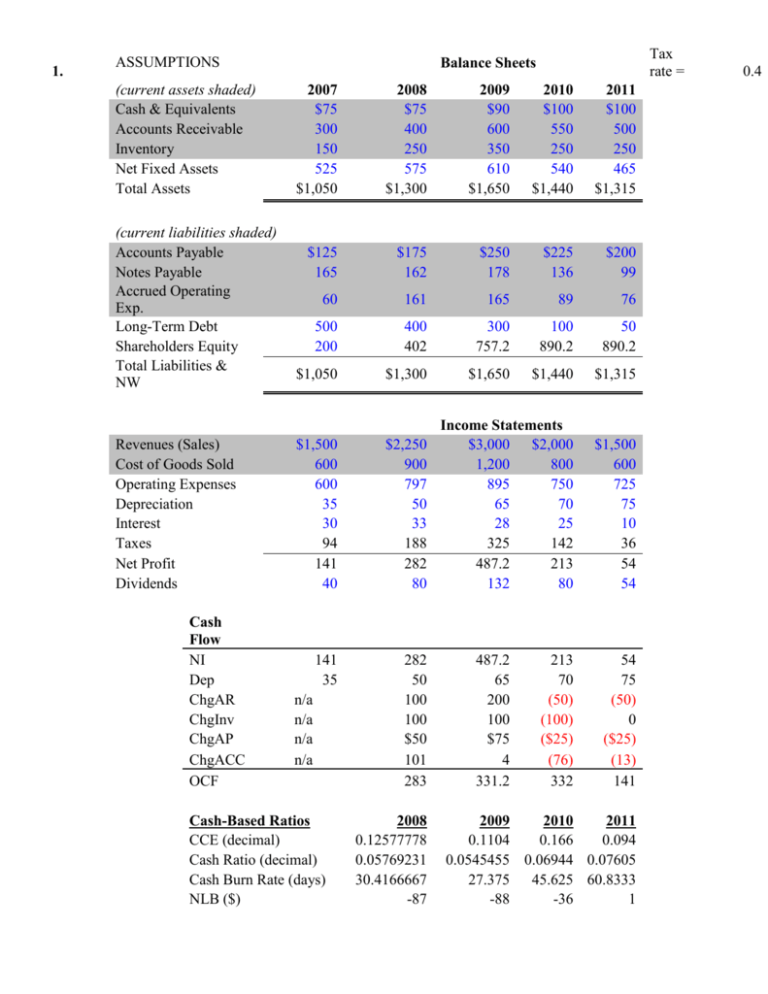
1. ASSUMPTIONS (current assets shaded) Cash & Equivalents Accounts Receivable Inventory Net Fixed Assets Total Assets (current liabilities shaded) Accounts Payable Notes Payable Accrued Operating Exp. Long-Term Debt Shareholders Equity Total Liabilities & NW Revenues (Sales) Cost of Goods Sold Operating Expenses Depreciation Interest Taxes Net Profit Dividends Cash Flow NI Dep ChgAR ChgInv ChgAP ChgACC OCF Tax rate = Balance Sheets 2007 $75 300 150 525 $1,050 2008 $75 400 250 575 $1,300 2009 $90 600 350 610 $1,650 2010 $100 550 250 540 $1,440 2011 $100 500 250 465 $1,315 $125 165 $175 162 $250 178 $225 136 $200 99 60 161 165 89 76 500 200 400 402 300 757.2 100 890.2 50 890.2 $1,050 $1,300 $1,650 $1,440 $1,315 Income Statements $3,000 $2,000 1,200 800 895 750 65 70 28 25 325 142 487.2 213 132 80 $1,500 600 725 75 10 36 54 54 $1,500 600 600 35 30 94 141 40 $2,250 900 797 50 33 188 282 80 141 35 282 50 100 100 $50 101 283 n/a n/a n/a n/a Cash-Based Ratios CCE (decimal) Cash Ratio (decimal) Cash Burn Rate (days) NLB ($) 2008 0.12577778 0.05769231 30.4166667 -87 487.2 65 200 100 $75 4 331.2 213 70 (50) (100) ($25) (76) 332 54 75 (50) 0 ($25) (13) 141 2009 2010 2011 0.1104 0.166 0.094 0.0545455 0.06944 0.07605 27.375 45.625 60.8333 -88 -36 1 0.4 Discuss and interpret: Except for the CCE, the ratios suggest increases in the cash ratio, burn rate, and NLB. Although the firm appears to be less efficient at converting revenues into cash flow, the overall liquidity positon has improved over the sample period. 2. a. b. 3. A desired cash burn rate of 250 days and no change in COGS implies that the firm have cash holdings equal to 411.0 This value implies that cash holdings would need to increase by $311.0 from the end of 2011. Assuming that the firm cannot accumulate the needed cash to achieve a cash then management must reduce COGS BR of 250 to YEAR 2003 2004 2005 2006 2007 2008 2009 2010 2011 2012 Exp 2013 Rev 2013 NCF ($M) 15 0 -1 2 4 8 0 2 -1 5 8.1 6.8 Cash holdings & credit lines = Expected NCF Std. Dev. NCF Lambda Probibility of illiquid Probibility of liquid 3.4 4.7370877 1.9210115 2.74% 97.26% Lambda Probibility of illiquid Probibility of liquid 1.6465813 4.98% 95.02% Liquidity Scenario 4. Cash + Unused Credit lines Anticipated Net Cash Flow Standard Deviation of NCF Lambda (λ) FIRM FIRM A FIRM B C $500 $1,000 $100 $3,000 $200 $1,500 $2,127 $729 $972 1.65 1.65 1.65 BR = $146 1 $M 250 Based on λ, all firms have equal liquidity. Initially, this result may seem surprising given that Firm B has the smallest liquidity position ($1,200), relative to Firms A and C. However, further inspection indicates that this lower level of liquidity is warranted given the less variable nature of Firm B’s net cash flows. 5. a. b. Maximum acceptable probability of illiquidity Cash holdings Expected next period cash flow Standard deviation of cash flow Lambda (λ) 2.25% $500 $650 $1,400 2.0046545 Minimum available credit line 2.004 = (500 + Credit Line* + $1,656.52 650)/1,400 Maximum acceptable probability of illiquidity Cash holdings Expected next period cash flow Standard deviation of cash flow Lambda (λ) 5.00% $500 $650 $1,400 1.6448536 Minimum available credit line 1.645 = (500 + Credit Line* + $1,152.80 650)/1,400 ASSUMPTIONS: annual disbursements, TCN fixed transaction cost, F annual opportunity rate, k minimum cash balance variance of daily net cash flows lower control limit 8. a. $5,000,000 $75 12.00% $0 $5,000,000 $0.00 Calculating the cash return level using the Miller-Orr model Z* = ((3 x $75 x $5,000,000)/(4 x .12/365))^(1/3) Z* = $9,493 b. Calculating the average cash balance using Miller-Orr model average cash balance = (4 / 3)(Z*) + LCL = $12,657.27 c. Explanation and use of findings Assuming that the LCL = $0, Z* is the dollar return point. When the current cash balance hits the UCL, the amount of securities to purchase is the dollar amount that will bring the cash balance down to the Z* level. d. Effect of a change in variance of daily net cash flows annual disbursements, TCN $5,000,000 fixed transaction cost, F $75 annual opportunity rate, k 12.00% minimum cash balance $0 variance of daily net cash flows $10,000,000 lower control limit $0.00 Z* = $11,960 higher than The cash return level is only 26% previously. e. Miller-Orr results versus Baumol results Miller-Orr cash return level = Baumol cash return level = Baumol, average cash balance Miller-Orr, average cash balance estimated variance of daily cash flows standard deviation of cash flows $9,493 $79,057 $39,528 $12,657 $5,000,000 $2,236

