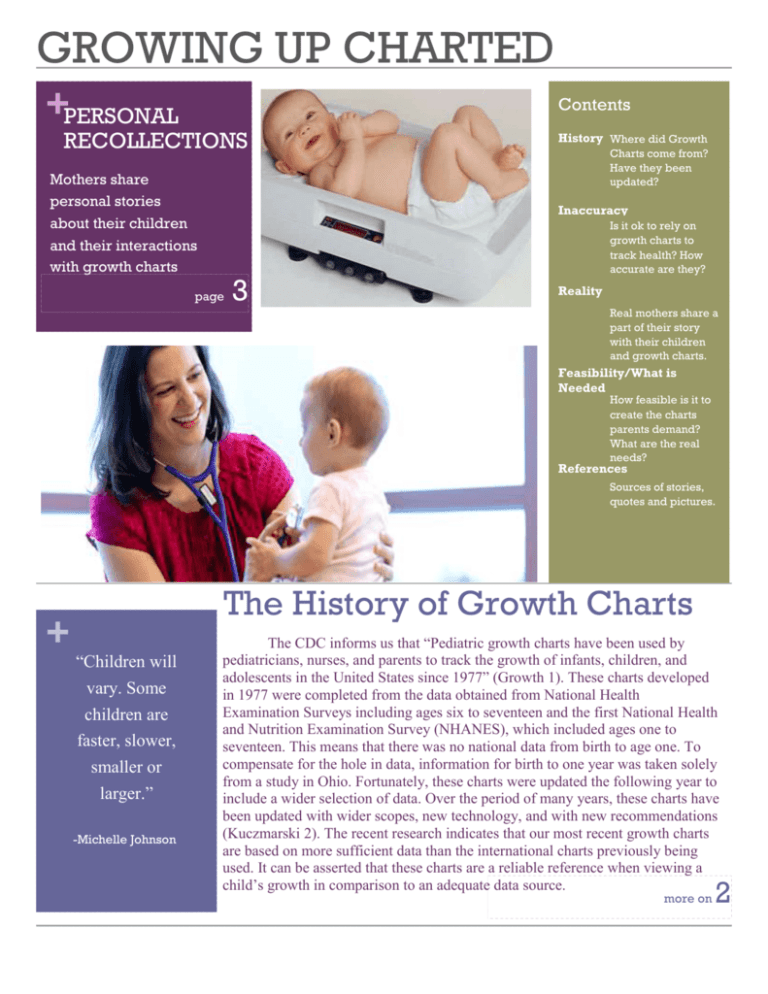
The History of Growth Charts
advertisement

GROWING UP CHARTED +PERSONAL Contents RECOLLECTIONS Mothers share personal stories about their children and their interactions with growth charts History Where did Growth Charts come from? Have they been updated? Inaccuracy page 3 Is it ok to rely on growth charts to track health? How accurate are they? Reality Real mothers share a part of their story with their children and growth charts. Feasibility/What is Needed How feasible is it to create the charts parents demand? What are the real needs? References Sources of stories, quotes and pictures. + The History of Growth Charts “Children will vary. Some children are faster, slower, smaller or larger.” -Michelle Johnson The CDC informs us that “Pediatric growth charts have been used by pediatricians, nurses, and parents to track the growth of infants, children, and adolescents in the United States since 1977” (Growth 1). These charts developed -Michelle Johnson in 1977 were completed from the data obtained from National Health Examination Surveys including ages six to seventeen and the first National Health and Nutrition Examination Survey (NHANES), which included ages one to seventeen. This means that there was no national data from birth to age one. To compensate for the hole in data, information for birth to one year was taken solely from a study in Ohio. Fortunately, these charts were updated the following year to include a wider selection of data. Over the period of many years, these charts have been updated with wider scopes, new technology, and with new recommendations (Kuczmarski 2). The recent research indicates that our most recent growth charts are based on more sufficient data than the international charts previously being used. It can be asserted that these charts are a reliable reference when viewing a child’s growth in comparison to an adequate data source. more on 2 Paige Hudson Inaccuracy Many parents have concerns over the growth of their children. The growth charts used by pediatricians worldwide are a reference tool developed from a sampling of data. Yes, children are individuals and as such cannot be held to one standard. That is why growth charts have a curve to show which percentage a child may fall into. An article from Parenting.com puts parents at ease: “experts say there's rarely reason for concern. For starters, healthy kids come in a wide range of shapes and sizes, and they don't grow at a steady rate, either. Your child can look very different from your fiends' kids -- or from his own siblings at the same age -- and still be completely normal” (Renkl 1). A growth chart may not have a node for an outlier who is gaining weight or getting taller at a rate than other children, and that shows that not everyone can fit on a standardized chart. The CDC’s explains a few exclusions from their updated charts: “11 infants whose recumbent length and stature differed by greater than or equal to 5 cm were excluded from the length-for-age, weight-for-length, stature-for-age, weight-for-stature, and BMI-for-age charts…two outlier values, one for head circumference of an infant girl, and one for recumbent length of an infant boy, were excluded because the measurement values and the sampling weights were Eng 252 Vol. 1 Lorem ipsum dolor sit amet, consectetuer adipiscing elit. extreme” (Kuczmarski 5). Though these charts cannot represent the health of each and every child, they are able to provide averages to show how a large sampling of an age group are developing and whether or not a child is developing at the same rate. 2 Paige Hudson Eng 252 Vol. 1 Spencer and Kaytie Michelle I really like development charts. They gave me something to compare too. They helped me, as first time mother, know what to expect and when. I do think people /moms need to realize these are averages. Children will vary. Some children are faster, slower, smaller or larger. Also, these charts can help doctors and caseworkers detect cases of neglect, abuse, malnutrition and presence of learning disabilities. With Spencer, he met all the milestones until it came to verbal and comprehension, which is about a year, give or take. We knew something was going on for a couple years, but no one believed us. Then at his four-year well child check, we expressed it again and our doctor agreed and sent us finally for a mental evaluation. We went to that appointment and in a matter of minutes, we found Spencer was mildly autistic. Karen and Brooklyn In Utah, they had programs offered through the school system to help children with delays. There were ladies that would come to our house and test Brooklyn to see where she fell on the development charts. It was determined that she was delayed and she would benefit from their program…She attended a regular kindergarten class and had a fantastic teacher that understood our situation. By the end of the year, Brooklyn wasn't where she needed to be. She struggled with reading, writing, drawing... everything. We decided to put her in kindergarten a second time with the same teacher. This time, she thrived. 3 Paige Hudson Eng 252 Feasibility The CDC has made it clear that high demands cannot always be met. Parents often feel that the reference charts should always catch what is going on with their child, as well as flag them when they need help. The facts are, “it is not feasible to conduct a study that would obtain measures on the total U.S. population of children” (Kuczmarski 15). It is not realistic for parents and healthcare professionals to rely on these reference charts for a diagnosis or even to flag every child that should be tested for more help. Just as the argument stands with many that all children develop differently, each reference chart cannot be held responsible for a child’s well being. Suffice it to say that partnering with observant parents, skilled healthcare professionals, and the reference charts results in children getting the help that they need. No these charts do not accurately depict the health of an individual child, that is not the purpose behind them. Yes, the reference charts are backed by sufficient research. They are being re-evaluated and revised from time to time to make sure they are keeping up with modern health trends. The final question posed, how can we know that what our doctors tell us is reality, is not so easily answered. That is in the judgment of a parent. If you feel that your doctor or other healthcare professional is not providing the care you believe your child needs, you should probably find a new healthcare provider. These providers are as unique and numbered as the children that need them. Vol. 1 Just as the argument stands with many that all children develop differently, each reference chart cannot be held responsible for a child’s well being. What is Needed Growth charts are being viewed incorrectly: they are reference charts. These are not to be used as a final word of diagnosis or evaluation. A chart that informs parents of their child’s health is not what is needed. The existing charts are a sufficient reference to screen for children who are not being taken care of or who are in need of serious medical attention. What is needed to know a child’s health is attentive parents and skilled healthcare professionals. To reiterate what the CDC has stated, it is not realistic to gather data on all the children in the United States. The services that are available to parents regarding their child’s health are numerous. Sometimes a local pediatrician is not enough. This puts the pressure on parents to be present and proactive in the lives of their children. It is suggested that parents ask questions to help receive the best care for your child. “Having regular well-child visits with your - sodales. child’s doctor and raising the concerns that matter most to you are key ingredients in helping the doctor know you and your child, and in forming a reliable and trustworthy relationship” (WellChild 1). It can be difficult to know what to ask your pediatrician when at a well-child check. The Academy of Pediatrics recommends “jotting down three to five questions and bringing them to the visit” (Well-Child 1). In sum, look to growth reference charts for help knowing if your child is in need of serious medical attention. The charts are sufficient and are not in need of revision at this current time. It is not a bad thing to grow up charted. All health advice and references available to every person help to create a better individual and in turn a better world. 4 + + Works Cited Bouvier, Kaytie. Personal Interview. 11 February 2014. “Growth Charts.” Centers for Disease Control and Prevention. 9 September 2010. Online. 10 February 2014. JAMA Pediatrics Development of a Research Child Growth Reference and Its Comparison With the Current International Growth Reference May 1998, Vol 152, No. 5. Online. 10 February 2014. Johnson, Michelle. Personal Interview. 11 February 2014. Kuczmarski RJ, Ogden CL, Guo SS, et al. 2000 CDC growth charts for the United States: Methods and development. National Center for Health Statistics. Vital Health Stat 11(246). 2002 Moorhead, Kimberly. Personal Interview. 11 February 2014. Powell, Karen. Personal Interview. 12 February 2014 Renkl, Margaret. “What Kids’ Growth Charts Don’t Tell You.” Parenting.com. 27 December 2010: Online. http://www.cnn.com/2010/HEALTH/12/27/kids.growth.charts.parenting/ “Well-Child Care: A Check-Up for Success.” The American Academy of Pediatrics. 7 August + 2013. Online. 15 February 2014. +


