tpj12382-sup-0001-FigS1-S10
advertisement
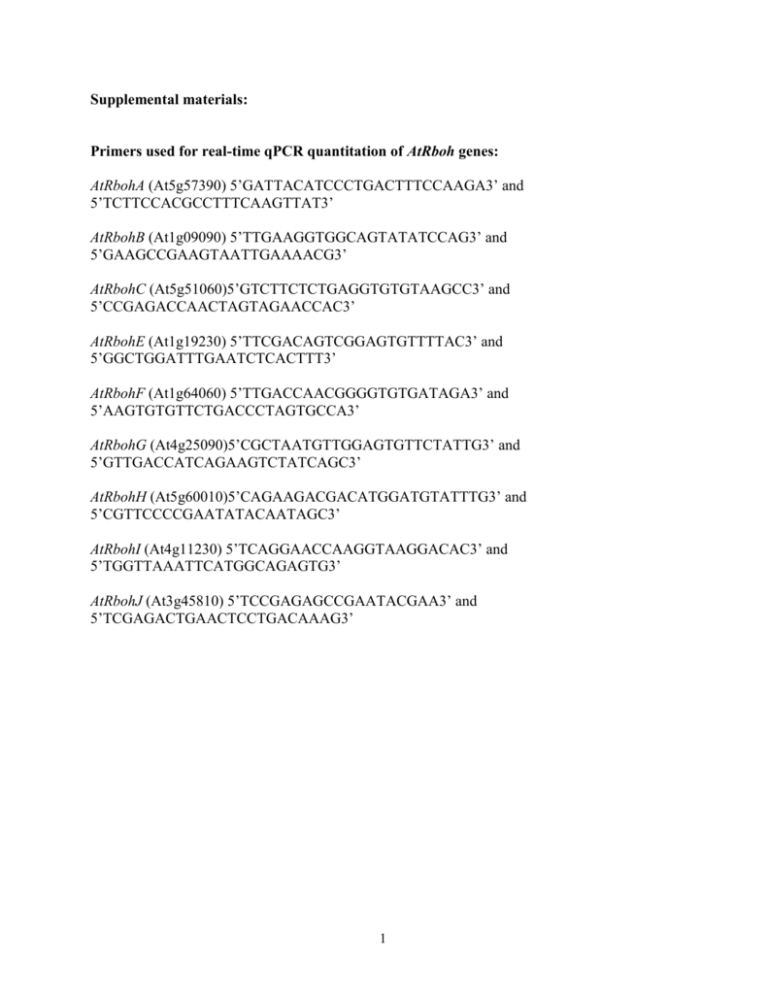
Supplemental materials: Primers used for real-time qPCR quantitation of AtRboh genes: AtRbohA (At5g57390) 5’GATTACATCCCTGACTTTCCAAGA3’ and 5’TCTTCCACGCCTTTCAAGTTAT3’ AtRbohB (At1g09090) 5’TTGAAGGTGGCAGTATATCCAG3’ and 5’GAAGCCGAAGTAATTGAAAACG3’ AtRbohC (At5g51060)5’GTCTTCTCTGAGGTGTGTAAGCC3’ and 5’CCGAGACCAACTAGTAGAACCAC3’ AtRbohE (At1g19230) 5’TTCGACAGTCGGAGTGTTTTAC3’ and 5’GGCTGGATTTGAATCTCACTTT3’ AtRbohF (At1g64060) 5’TTGACCAACGGGGTGTGATAGA3’ and 5’AAGTGTGTTCTGACCCTAGTGCCA3’ AtRbohG (At4g25090)5’CGCTAATGTTGGAGTGTTCTATTG3’ and 5’GTTGACCATCAGAAGTCTATCAGC3’ AtRbohH (At5g60010)5’CAGAAGACGACATGGATGTATTTG3’ and 5’CGTTCCCCGAATATACAATAGC3’ AtRbohI (At4g11230) 5’TCAGGAACCAAGGTAAGGACAC3’ and 5’TGGTTAAATTCATGGCAGAGTG3’ AtRbohJ (At3g45810) 5’TCCGAGAGCCGAATACGAA3’ and 5’TCGAGACTGAACTCCTGACAAAG3’ 1 Figure S1. Flg22-induced MAPK activation in DEX-pretreated EV, KR, and DD seedlings. DD, KR, and empty vector (EV) control seedlings were pretreated with DEX (1 μM) for 3 hr, and then with flg22 (30 nM). The seedlings were collected at indicated times after flg22 treatment. MAPK activation was determined by immunoblot analysis using anti-pTEpY antibody. 2 Figure S2. Overexpression of MPK6 partially compromises the flg22-induced ROS burst. (a) Overexpression of MPK6 partially compromises the flg22-induced ROS burst. Two-week-old MPK6 OE and EV control transgenic Arabidopsis seedlings were treated with flg22 (30 nM). ROS burst was monitored by luminol-based assay. Error bars indicate SD (n = 3). Double asterisks above the data points indicate differences that are statistically very significant (p<0.01). (b) Levels of MPK6 protein in the MPK6 OE transgenic seedlings. Immunoblot analysis using an antibody against MPK6 was used to determine the relative level of transgenic FLAG-tagged MPK6 (F-MPK6) versus the endogenous MPK6. EV control sample only had endogenous MPK6. (c) Higher levels of MPK6 activation in 35S:FLAG-MPK6 (MPK6 OE) transgenic seedlings after flg22 treatment. MPK6 OE and empty vector (EV) control seedlings were treated with flg22 (30 nM), and the seedlings were collected at indicated times. MAPK activation was determined by an in-gel kinase assay with MBP as a substrate. FLAG-epitope tagged MPK6 (F-MPK6) from the transgene is slight bigger than the endogenous MPK6 because of the FLAG tag. 3 Figure S3. Activation of MPK3, MPK6, and MPK4 by exogenously added H2O2. Two-week-old mpk3, mpk6, mpk4, and their wild-type controls (Col-0 for mpk3 and mpk6; and Ler-0 for mpk4) were treated with H2O2 (10 mM), and seedlings were collected at indicated times. Control samples treated with equal volume of water were collected as well. MAPK activation was determined by an in-gel kinase assay with MBP as a substrate. 4 Figure S4. Flg22-induced MAPK activation is independent of ROS burst. (a) ROS-burst induced by flg22 is completely abolished in atrbohD mutant. Two-week-old wild-type control (Col-0) and atrbohD mutant seedlings were treated with flg22 (30 nM). ROS burst was monitored by luminol-based assay. Error bars indicate SD (n = 3). (b) Normal MAPK activation in atrbohD mutant after flg22 treatment. Two-week-old Col-0 and atrbohD mutant seedlings were treated with flg22 (30 nM), and the seedlings were collected at indicated times. MAPK activation was determined by an in-gel kinase assay with MBP as a substrate. (c-d) Both ROS burst and MAPK activation are dependent on the sensing of flg22. Two-week-old wild-type control (Col-0) and fls2 mutant seedlings were treated with flg22 (30 nM). ROS burst was monitored by luminol-based assay. Error bars indicate SD (n = 3). Seedlings were collected at indicated times after flg22 treatment for preparation of protein extracts. MAPK activation was determined by an in-gel kinase assay with MBP as a substrate. 5 Figure S5. Inflorescence phenotype of MPK6SR plants after NA-PP1 treatment. MPK6SR plants were grown hydroponically, and NA-PP1 inhibitor (1 µM final concentration) was added into the medium just before the plants started to bolt. The pictures were taken a week later. 6 Figure S6. Different lengths of NA-PP1 pre-treatment give similar ROS burst in MPK6SR seedlings after flg22 treatment. Two-week-old SR31 seedlings were pretreated with NA-PP1 (1 µM final concentration) for 30 min (a) (same as Figure 4e), 60 min (b), and 120 min (c) before flg22 treatment (30 nM final concentration). ROS burst was monitored by luminol-based assay. Error bars indicate SD (n = 3). A single asterisk above the data point indicates a difference that is statistically significant (p<0.05). 7 Figure S7. SA-potentiation of ROS burst is not associated with enhanced AtRbohD expression. Two-week-old Col-0, npr1, and NahG seedlings were pre-treated with SA (100 µM) or equal volume of DMSO solvent for two days, and then treated with flg22 (30 nM). Samples were collected at indicated times after flg22 treatment. Total RNA was extracted. After reverse transcription, the levels of AtRbohD gene expression were determined by real-time PCR analysis. The comparative Ct method was used to calculate the levels of transcripts relative to that in Col0 seedlings with DMSO pretreatment, but no flg22 treatment (0 hr), which was set as 1. The levels of EF1 transcript were used to normalize different samples. Error bars indicate SD (n = 3). 8 Figure S8. Expression of AtRboh genes in Arabidopsis seedlings after flg22 treatment. Two-week-old Arabidopsis seedlings were treated with flg22 (30 nM). Samples were collected at indicated times for total RNAs isolation. Expressions of all ten AtRboh genes were quantified by real-time PCR. Levels of AtRboh gene expression were calculated as percentages of EF1 transcript by the Ct method. Error bars indicate standard deviation (n = 3). ND, not detectable. 9 Figure S9. Elevated PR1 gene expression in mpk4 seedlings. Individual seedlings from segregating population (mpk4 homozygous plants do not set seeds in our growth conditions) were collected when they were two-weeks old. After genotyping each seedling, total RNAs were isolated from three randomly selected wild-type (Ler-0) and three randomly selected homozygous mpk4 seedlings. Expression of PR1 gene was quantified by realtime RT-PCR. Levels of PR1 gene expression were calculated as percentages of EF1 transcript by the Ct method. Error bars indicate standard deviation (n = 3). 10 Figure S10. Sample images from luminol-based ROS burst assays. (a) Multiple leaves in 24-well plates were used in the ROS assay in Figure 2 due to the abnormal morphology of GVG:MPK6-rescued mpk3 mpk6 double mutant seedlings (Wang et al. 2007). (b) Single leaf per well in 48-well plates was used in all other ROS-burst analyses in this report. Upper panels are images taken using the Photek photon-counting camera that detects the ROS generation, and the lower panels are corresponding images taken using a regular digital camera. 11
