Conclusion and Evaluation
advertisement
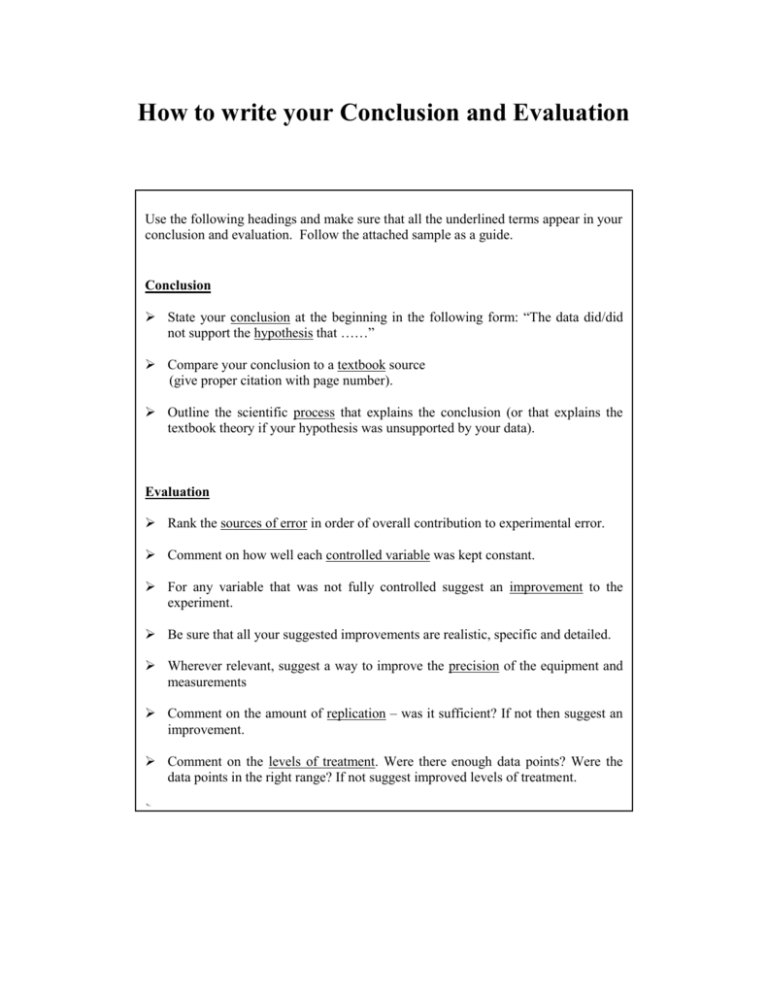
How to write your Conclusion and Evaluation Use the following headings and make sure that all the underlined terms appear in your conclusion and evaluation. Follow the attached sample as a guide. Conclusion State your conclusion at the beginning in the following form: “The data did/did not support the hypothesis that ……” Compare your conclusion to a textbook source (give proper citation with page number). Outline the scientific process that explains the conclusion (or that explains the textbook theory if your hypothesis was unsupported by your data). Evaluation Rank the sources of error in order of overall contribution to experimental error. Comment on how well each controlled variable was kept constant. For any variable that was not fully controlled suggest an improvement to the experiment. Be sure that all your suggested improvements are realistic, specific and detailed. Wherever relevant, suggest a way to improve the precision of the equipment and measurements Comment on the amount of replication – was it sufficient? If not then suggest an improvement. Comment on the levels of treatment. Were there enough data points? Were the data points in the right range? If not suggest improved levels of treatment. Example of Exemplary work Lab Title: Investigating the growth of bean seedlings growing in light of different wavelengths Conclusion - The data did not support the hypothesis that mongo seedling growth would be greatest under white light followed by (in order) blue, red, yellow and green light. Although the green and yellow light yielded the least amount of plant growth, as expected, the plants growing under red light had a greater average increase in stem length than those growing under white light. A t-test showed this difference to be insignificant (p>0.05). Nevertheless the result was unexpected and it contradicts my biology textbook, which states that white light contains the full spectrum of visible light and as such contains all the wavelengths useful for photosynthesis (Campbell1). Therefore either my textbook is wrong or the present experiment had sources of error that prevented us from supporting the hypothesis. Of the two options, the second is far more probable: our experiment surely had flaws and I shall therefore consider the relative importance of each possible source of error. Evaluation - I shall begin this evaluation by ranking the sources of error from those that I consider to be the most significant to those that are likely to be the least significant: 1) the temperature was not properly controlled; 2) the light intensity was not properly controlled; 3) the precise wavelengths of light were not determined; 4) the seedling characteristics were not properly controlled; 5) the measurement of stem-length lacked precision; 6) the experiment was not replicated sufficiently; and 7) plants were not randomly assigned to the different treatments. The variable Temperature Temperature is a variable that must be kept constant because it can affect the rate of photosynthesis. Enzyme activity is the mechanism by which temperature affects photosynthesis (Campbell, Pp 186-187). However, in this experiment we did not use thermometers to confirm that the temperature was kept constant. Moreover, there are reasons to believe that the temperature varied between plants growing under different colored lights. One cause of the temperature varying is that care was not taken to ensure that each seedling was placed at an equal distance from the light source. As a result, plants growing closer to the light bulbs would have experienced higher temperatures than those further away. The high incidence of seedlings dying during the experiment may have been due to excessive heat from the light bulbs. Another reason that temperature may have varied is that the experiment was set up in a hallway, where students frequently opened a door to enter and exit the building. Each time the door was opened warm air would have entered the building. Thus plants growing closer to the door may have experienced warmer temperatures than those further away. The variable Light Intensity Light intensity (the concentration of photons) is a variable that must be kept constant because it affects the rate of photosynthesis. According to Campbell (p 191) plants use pigments to harvest the energy of photons. When a photon strikes a pigment, the pigment harnesses the photon’s energy to begin the process of photosynthesis. However, in this experiment we did not measure light intensity. Moreover, the light intensity probably varied between plants growing under different colored lights because light spreads out as it travels from its source. Thus, plants placed further away from the light source would have had less energy for photosynthesis than those closer to the light bulbs. The variable Wavelength of Light The wavelength of each light source was not determined. Therefore the levels of treatment are not known precisely. In other words, we can only say that the light sources were blue, red, yellow and green but we can not say where in the range of blue light (and red, yellow and green light) our experiment was conducted. Moreover, we don’t know if our green light was pure green light or if it emerged from a mixture of blue and yellow light. In addition, there was no divider placed between the plants growing under different light sources. As a result plants growing under a bulb of one color may have been contaminated by the light of another set up. One more problem is that the door in the hallway where the experiment was performed contained a window. Thus natural sunlight entered the hallway thereby exposing all plants to the full spectrum of visible wavelengths. Since the red light set up was closer to the door than the white light set up, the plants growing under the former set up probably received a greater boost of light energy from the sun than the plants under the latter set up. This could be the reason why the plants under red light grew more on average than the plants under white light. 1 Campbell, N.A. 1996. Biology, Fourth Edition. Pp 184-193. The Benjamin/Cummings Publishing Company Inc. New York. The variable Seedling Characteristics There was variation in the height of the seedlings when we began the experiment. This natural variation in seedling growth may be responsible for some of the error in this experiment. Moreover, some seedlings were generally healthier and more robust than others. However, we did not record the condition of plants at the start of the experiment so it is possible that the plants growing under one light source were naturally destined to grow better than the plants under another light source. Measuring stem length We did not develop a standardized method for measuring the length of stems. Therefore, some students may have measured differently than others thereby lowering the precision of our data set. Experimental design The experiment was fairly well replicated with 18 seedlings grown at each level of treatment. However, due to a fairly high death rate our sample sizes were reduced to 12, 17, 15, and 17 in the white, blue, red, and yellow light, respectively. Another problem is that we did not randomly assign the plants to each treatment. As a result we may have biased the experiment if we tended to select the healthiest or largest seedlings first (and placed them into the red light set up), which was the first set up in the hallway. Suggested improvements to the procedure Considering the aforementioned sources of error it is necessary to repeat the experiment with the following improvements: 1. The experiment should be conducted in a locked room so that the opening and closing of the door is kept to an absolute minimum. In this way we will be better able to control the temperature. 2. Each set up should be self-contained so that there is no cross-contamination of light between the setups. This could be achieved by growing the plants in large boxes with the light source suspended just below the top of the box and with aluminum foil covering the top to prevent light from escaping. In this scenario we would need to add a large container of water to each box to keep the plants from desiccating, to regulate the temperature and to ensure that all the set ups have the same humidity. We would need to use a low wattage bulb to prevent the plants from over-heating and to minimize the risk of fire and hazard to students. 3. Each plant should be placed at an equal distance from its light source to control the variables temperature and light intensity. 4. A thermometer should be placed amongst the seedlings under each light source and checked periodically to ensure that each set up has the same temperature throughout the investigation. 5. A photospectrometer should be used to measure the proportions of light of different wavelengths emitted from each light source. And we should study a range of wavelengths within each color to produce an accurate action spectrum that doesn’t generalize each color on the basis of a single wavelength within the spectrum of that color. 6. The plants should be compared at the start to ensure that they are all of similar height and health. Thus a large surplus of seedlings should be grown to ensure that we have a sufficient number of similar plants to work with. It would take too long to quantify the health of seedlings precisely (such as by measuring the thickness of the stems using calipers and measuring leaf color with a photospectrometer) so we will simply make a qualitative judgment based on the overall appearance. 7. A standardized method must be developed to ensure that each student measures the stems in the same way. One method would be to remove the seedlings from the soil, rinse them with water, and cut the stem with a razor blade at the point where the stem begins to loose its green color (i.e., the cut off point between the above ground and below ground portions of the stem). The stem can be measured from this cut off point to the most apical node. 8. The plants should be randomly assigned to the treatments to remove the possibility of human bias.
