Chapter 1 Extra Practice Answers
advertisement
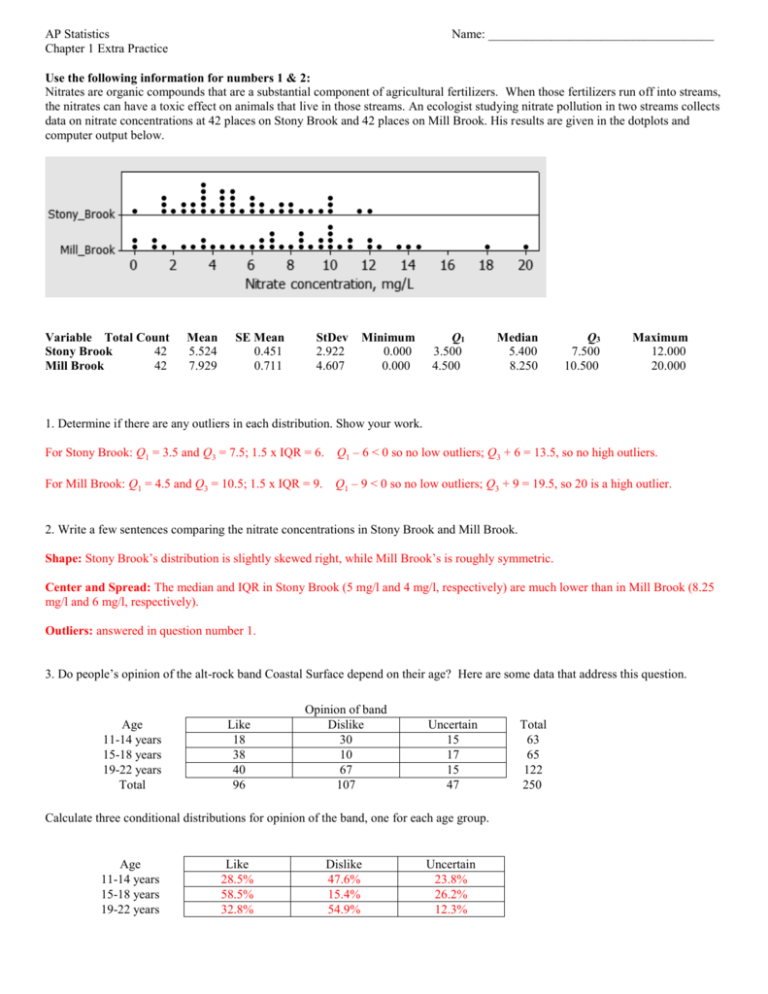
AP Statistics Chapter 1 Extra Practice Name: ____________________________________ Use the following information for numbers 1 & 2: Nitrates are organic compounds that are a substantial component of agricultural fertilizers. When those fertilizers run off into streams, the nitrates can have a toxic effect on animals that live in those streams. An ecologist studying nitrate pollution in two streams collects data on nitrate concentrations at 42 places on Stony Brook and 42 places on Mill Brook. His results are given in the dotplots and computer output below. Variable Total Count Stony Brook 42 Mill Brook 42 Mean 5.524 7.929 SE Mean 0.451 0.711 StDev 2.922 4.607 Minimum 0.000 0.000 Q1 3.500 4.500 Median 5.400 8.250 Q3 7.500 10.500 Maximum 12.000 20.000 1. Determine if there are any outliers in each distribution. Show your work. For Stony Brook: Q1 = 3.5 and Q3 = 7.5; 1.5 x IQR = 6. Q1 – 6 < 0 so no low outliers; Q3 + 6 = 13.5, so no high outliers. For Mill Brook: Q1 = 4.5 and Q3 = 10.5; 1.5 x IQR = 9. Q1 – 9 < 0 so no low outliers; Q3 + 9 = 19.5, so 20 is a high outlier. 2. Write a few sentences comparing the nitrate concentrations in Stony Brook and Mill Brook. Shape: Stony Brook’s distribution is slightly skewed right, while Mill Brook’s is roughly symmetric. Center and Spread: The median and IQR in Stony Brook (5 mg/l and 4 mg/l, respectively) are much lower than in Mill Brook (8.25 mg/l and 6 mg/l, respectively). Outliers: answered in question number 1. 3. Do people’s opinion of the alt-rock band Coastal Surface depend on their age? Here are some data that address this question. Age 11-14 years 15-18 years 19-22 years Total Like 18 38 40 96 Opinion of band Dislike 30 10 67 107 Uncertain 15 17 15 47 Calculate three conditional distributions for opinion of the band, one for each age group. Age 11-14 years 15-18 years 19-22 years Like 28.5% 58.5% 32.8% Dislike 47.6% 15.4% 54.9% Uncertain 23.8% 26.2% 12.3% Total 63 65 122 250 Use the following information for numbers 4 & 5: Below is a box plot of the amounts of oil recovered from 38 wells (in thousands of barrels) in the Devonian Richmond Dolomite area of the Michigan basin. 4. The mean of this distribution is 50.39 and the median is 47. Explain why you could have predicted that the mean would be higher than the median by looking at the boxplot. The high outlier will cause the mean to be higher, but will have no effect on the median. 5. The largest amount of oil recovered was 157,000 barrels. Suppose that it was replaced with another basin that had 254,000 barrels. Without performing any calculations, indicate whether each of the following measures of center and spread would increase, decrease, or remain the same. a) mean Increase b) median No change c) standard deviation Increase d) interquartile range No change
