DOC - StatsTools
advertisement
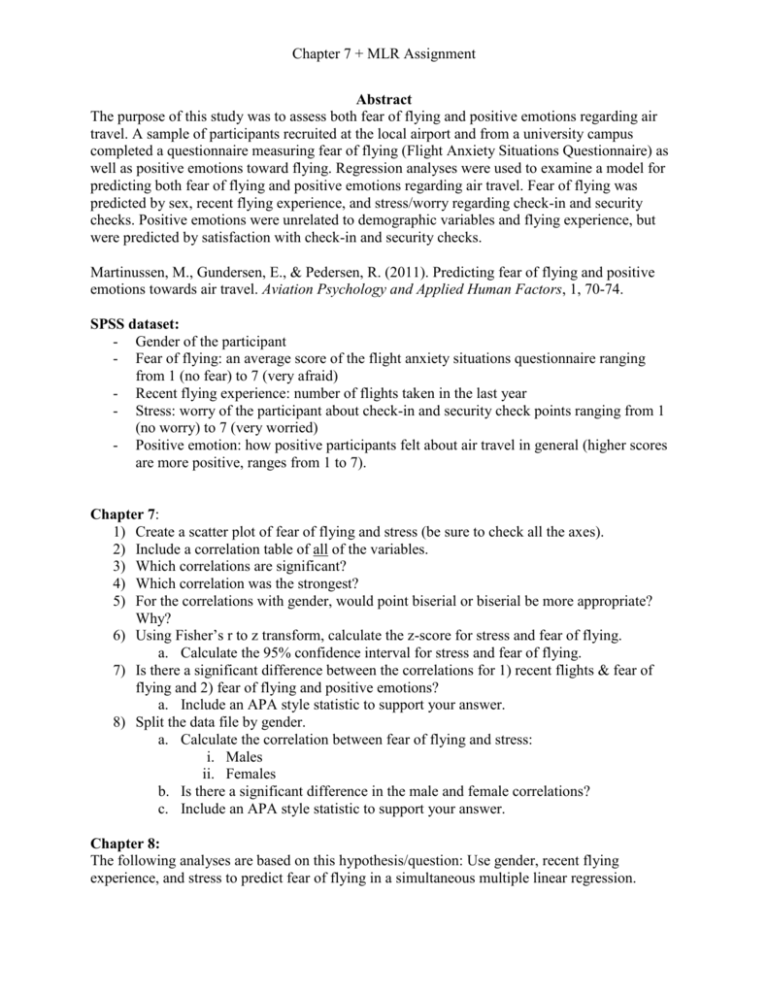
Chapter 7 + MLR Assignment Abstract The purpose of this study was to assess both fear of flying and positive emotions regarding air travel. A sample of participants recruited at the local airport and from a university campus completed a questionnaire measuring fear of flying (Flight Anxiety Situations Questionnaire) as well as positive emotions toward flying. Regression analyses were used to examine a model for predicting both fear of flying and positive emotions regarding air travel. Fear of flying was predicted by sex, recent flying experience, and stress/worry regarding check-in and security checks. Positive emotions were unrelated to demographic variables and flying experience, but were predicted by satisfaction with check-in and security checks. Martinussen, M., Gundersen, E., & Pedersen, R. (2011). Predicting fear of flying and positive emotions towards air travel. Aviation Psychology and Applied Human Factors, 1, 70-74. SPSS dataset: - Gender of the participant - Fear of flying: an average score of the flight anxiety situations questionnaire ranging from 1 (no fear) to 7 (very afraid) - Recent flying experience: number of flights taken in the last year - Stress: worry of the participant about check-in and security check points ranging from 1 (no worry) to 7 (very worried) - Positive emotion: how positive participants felt about air travel in general (higher scores are more positive, ranges from 1 to 7). Chapter 7: 1) Create a scatter plot of fear of flying and stress (be sure to check all the axes). 2) Include a correlation table of all of the variables. 3) Which correlations are significant? 4) Which correlation was the strongest? 5) For the correlations with gender, would point biserial or biserial be more appropriate? Why? 6) Using Fisher’s r to z transform, calculate the z-score for stress and fear of flying. a. Calculate the 95% confidence interval for stress and fear of flying. 7) Is there a significant difference between the correlations for 1) recent flights & fear of flying and 2) fear of flying and positive emotions? a. Include an APA style statistic to support your answer. 8) Split the data file by gender. a. Calculate the correlation between fear of flying and stress: i. Males ii. Females b. Is there a significant difference in the male and female correlations? c. Include an APA style statistic to support your answer. Chapter 8: The following analyses are based on this hypothesis/question: Use gender, recent flying experience, and stress to predict fear of flying in a simultaneous multiple linear regression. 9) Screening: a. Check for accuracy errors and delete the data points (not people!) for any out of range numbers. i. Include SPSS output showing that the data are accurate. b. Missing data: fill in any missing data (created from above) with linear trend at point. i. Include SPSS output showing you have no missing data. c. Outliers i. How many high (outlier) residual scores do you have for studentized residuals (traditionally deleted residuals match)? ii. What is your leverage cut off score? iii. How many leverage outliers did you have? iv. What is your Cook’s cut off score? v. How many Cook’s outliers did you have? vi. What is your Mahalanobis df? vii. What is your Mahalanobis cut off score? viii. How many outliers did you have for Mahalanobis? ix. How many total outliers did you have across all three variables? x. Delete them! d. Multicollinearity i. Include a correlation table of your X variables. ii. Do your correlations meet the assumption for multicollinearity? e. Linearity i. Include a PP Plot. ii. Is linearity ok? f. Normality i. Include a residual histogram. ii. Is normality ok? g. Homogeneity/Homoscedasticity i. Include a residual scatter plot. ii. Is homoscedasticity ok (since this one is more important)? 10) Is the overall model significant? a. Include the model summary box. b. List the F statistic in APA style. 11) Which predictors are significant? a. Include the coefficients box. b. Fill in the following table (use this as an example for homework write ups). c. Change the title. d. Change the df to be the appropriate number. 12) Write up a short APA style results section for this experiment: a. Include a description of the study. b. Include a section on data screening: i. Did you have any outliers? What did you do with them? ii. Did you meet the assumptions for regression? c. Include a description of the analysis (what are the predictors, what is the DV, what type of analysis did you do?). Chapter 7 + MLR Assignment d. Include the overall model statistics. e. Include a description of the predictors (are they positively or negatively or not related to the DV?). f. Include a table of the beta values, and a reference to the table in your description (see table below). Table 1 Relevant Title of Your Table Here in Italics Predictor Beta Note. df = XX. t p pr2
