exponential decay of beer foam
advertisement

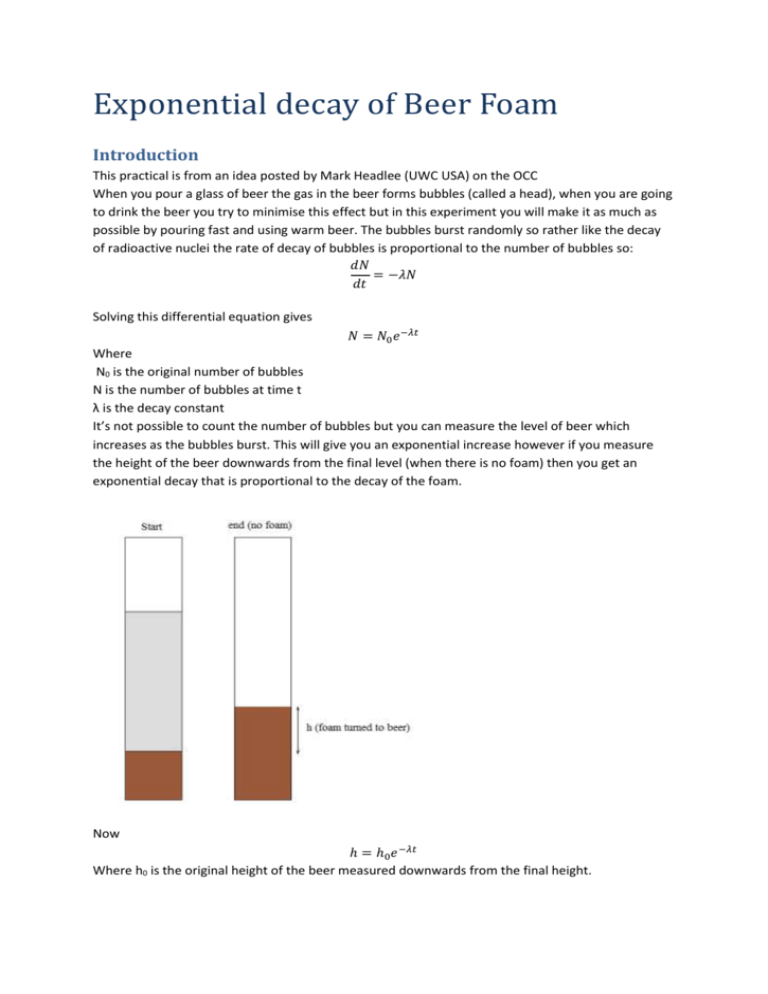
Exponential decay of Beer Foam Introduction This practical is from an idea posted by Mark Headlee (UWC USA) on the OCC When you pour a glass of beer the gas in the beer forms bubbles (called a head), when you are going to drink the beer you try to minimise this effect but in this experiment you will make it as much as possible by pouring fast and using warm beer. The bubbles burst randomly so rather like the decay of radioactive nuclei the rate of decay of bubbles is proportional to the number of bubbles so: 𝑑𝑁 = −𝜆𝑁 𝑑𝑡 Solving this differential equation gives 𝑁 = 𝑁0 𝑒 −𝜆𝑡 Where N0 is the original number of bubbles N is the number of bubbles at time t λ is the decay constant It’s not possible to count the number of bubbles but you can measure the level of beer which increases as the bubbles burst. This will give you an exponential increase however if you measure the height of the beer downwards from the final level (when there is no foam) then you get an exponential decay that is proportional to the decay of the foam. Now ℎ = ℎ0 𝑒 −𝜆𝑡 Where h0 is the original height of the beer measured downwards from the final height. Method You are going to pour the beer into a measuring cylinder but before you do this tape a strip of paper to the side of it; this will be used to mark the beer level. You will also need a stop clock; either use your mobile phone or an internet clock. Shake up the beer and pour it quickly into the cylinder, as soon as it settles a bit mark the beer level on the tape, do this every 5 seconds. If you are well organised up to 3 people can mark the same cylinder. Continue marking for 2 minutes then let the beer stand for a further 3 minutes. There will still be some foam in the flask but you are going to ignore this and assume all the bubbles have burst, mark this on the tape, this will be you zero. Take the tape off the cylinder and lay it flat ready for measuring with a ruler. Measure from the end point to the measured levels entering your results into an appropriate table. Analysis By linearising the equation plot a straight line graph to find the half life of beer bubbles.


