Homework #10 - BetsyMcCall.net
advertisement
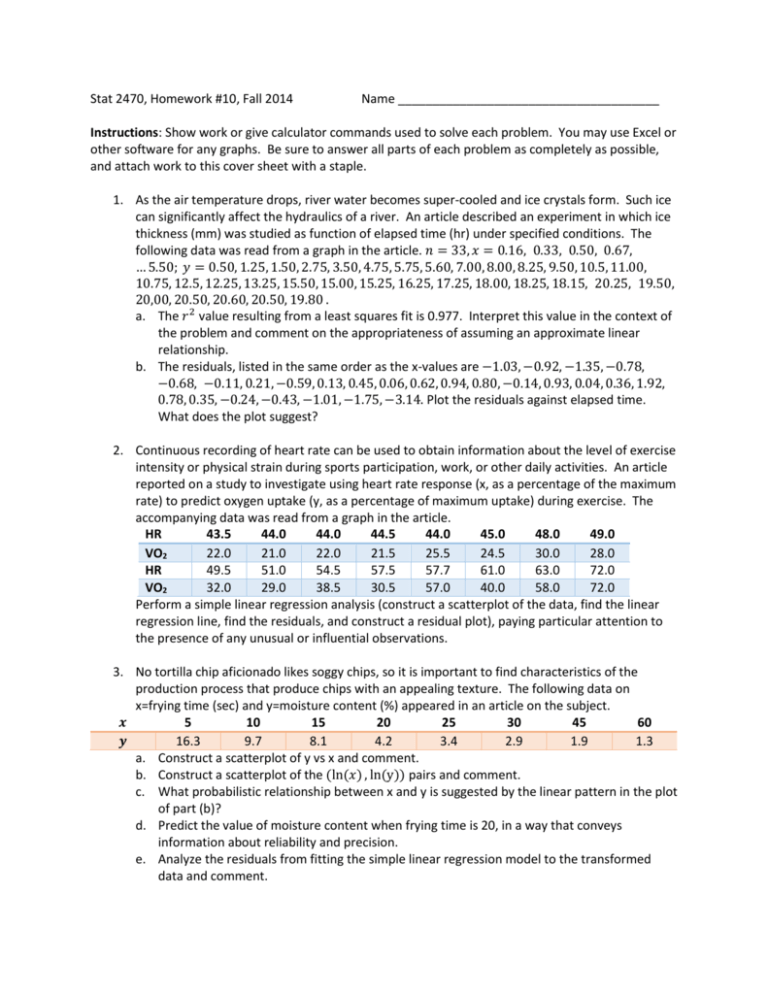
Stat 2470, Homework #10, Fall 2014 Name ______________________________________ Instructions: Show work or give calculator commands used to solve each problem. You may use Excel or other software for any graphs. Be sure to answer all parts of each problem as completely as possible, and attach work to this cover sheet with a staple. 1. As the air temperature drops, river water becomes super-cooled and ice crystals form. Such ice can significantly affect the hydraulics of a river. An article described an experiment in which ice thickness (mm) was studied as function of elapsed time (hr) under specified conditions. The following data was read from a graph in the article. 𝑛 = 33, 𝑥 = 0.16, 0.33, 0.50, 0.67, … 5.50; 𝑦 = 0.50, 1.25, 1.50, 2.75, 3.50, 4.75, 5.75, 5.60, 7.00, 8.00, 8.25, 9.50, 10.5, 11.00, 10.75, 12.5, 12.25, 13.25, 15.50, 15.00, 15.25, 16.25, 17.25, 18.00, 18.25, 18.15, 20.25, 19.50, 20,00, 20.50, 20.60, 20.50, 19.80 . a. The 𝑟 2 value resulting from a least squares fit is 0.977. Interpret this value in the context of the problem and comment on the appropriateness of assuming an approximate linear relationship. b. The residuals, listed in the same order as the x-values are −1.03, −0.92, −1.35, −0.78, −0.68, −0.11, 0.21, −0.59, 0.13, 0.45, 0.06, 0.62, 0.94, 0.80, −0.14, 0.93, 0.04, 0.36, 1.92, 0.78, 0.35, −0.24, −0.43, −1.01, −1.75, −3.14. Plot the residuals against elapsed time. What does the plot suggest? 2. Continuous recording of heart rate can be used to obtain information about the level of exercise intensity or physical strain during sports participation, work, or other daily activities. An article reported on a study to investigate using heart rate response (x, as a percentage of the maximum rate) to predict oxygen uptake (y, as a percentage of maximum uptake) during exercise. The accompanying data was read from a graph in the article. HR 43.5 44.0 44.0 44.5 44.0 45.0 48.0 49.0 VO2 22.0 21.0 22.0 21.5 25.5 24.5 30.0 28.0 HR 49.5 51.0 54.5 57.5 57.7 61.0 63.0 72.0 VO2 32.0 29.0 38.5 30.5 57.0 40.0 58.0 72.0 Perform a simple linear regression analysis (construct a scatterplot of the data, find the linear regression line, find the residuals, and construct a residual plot), paying particular attention to the presence of any unusual or influential observations. 3. No tortilla chip aficionado likes soggy chips, so it is important to find characteristics of the production process that produce chips with an appealing texture. The following data on x=frying time (sec) and y=moisture content (%) appeared in an article on the subject. 5 10 15 20 25 30 45 60 𝒙 16.3 9.7 8.1 4.2 3.4 2.9 1.9 1.3 𝒚 a. Construct a scatterplot of y vs x and comment. b. Construct a scatterplot of the (ln(𝑥) , ln(y)) pairs and comment. c. What probabilistic relationship between x and y is suggested by the linear pattern in the plot of part (b)? d. Predict the value of moisture content when frying time is 20, in a way that conveys information about reliability and precision. e. Analyze the residuals from fitting the simple linear regression model to the transformed data and comment. 4. A plot in an article suggests that the expected value of thermal conductivity y is a linear function of 104 ∙ 1/𝑥 where x is lamellar thickness. 240 410 460 490 520 590 745 8300 𝒙 12.0 14.7 14.7 15.2 15.2 15.6 16.0 18.1 𝒚 a. Estimate the parameters of the regression function and the regression function itself. b. Predict the value of thermal conductivity when lamellar thickness is 500 Å. 5. In each of the following cases, decide whether the given function is intrinsically linear. If so, identify 𝑥 ′ 𝑎𝑛𝑑 𝑦′, and then explain how a random error term 𝜖 can be introduced to yield an intrinsically linear probabilistic model. 1 a. 𝑦 = 𝛼+𝛽𝑥 1 b. 𝑦 = 1+𝑒 𝛼+𝛽𝑥 𝛼+𝛽𝑥 c. 𝑦 = 𝑒 𝑒 d. 𝑦 = 𝛼 + 𝛽𝑒 𝜆𝑥 6. The following data on y=glucose concentration (g/L) and x=fermentation time (days) for a particular blend of malt liquor was read from a scatterplot in an article. 1 2 3 4 5 6 7 8 𝒙 74 54 52 51 52 53 58 71 𝒚 a. Verify that a scatterplot of the data is consistent with the choice of a quadratic regression model. b. The estimated quadratic regression equation is 𝑦 = 84.482 − 15.875𝑥 + 1.7679𝑥 2 . Predict the value of glucose concentration for a fermentation time of six days, and compute the corresponding residual. c. Using SSE=61.77, what proportion of observed variation can be attributed to the quadratic regression relationship? d. The 𝑛 = 8 standardized residuals based on the quadratic model are 1.91, −1.95, −0.25, 0.58, 0.90, 0.04, −0.66, 0.20. Construct a plot of the standardized residuals versus x. Does the plot exhibit any troublesome features? e. The estimated standard deviation of 𝜇𝑌,6 = 1.69. Compute a 95% confidence interval for 𝜇𝑌,6 . f. Compute a 95% prediction interval for a glucose concentration observation made after 6 days of fermentation time. 7. Let y=sales at a fast-food outlet (1000s of $), 𝑥1 =number of competing outlets within a 1-mile radius, 𝑥2 =population within a 1-mile radius (1000s of people), and 𝑥3 be an indicator variable that equals 1 if the outlet has a drive-up window and 0 otherwise. Suppose that the true regression model is 𝑌 = 10.00 − 1.2𝑥1 + 6.8𝑥2 + 15.3𝑥3 + 𝜖. a. What is the mean value of sales when the number of competing outlets is 2, there are 8000 people within a 1-mile radius and that outlet has a drive-up window? b. What is the mean value of sales for an outlet without a drive-up window, that has three competing outlets and 5000 people within a 1-mile radius? c. Interpret 𝛽3 . 8. What conclusion would be appropriate for an upper-tailed chi-squared test in each of the following situations? a. b. c. d. 𝛼 𝛼 𝛼 𝛼 = 0.05, 𝑑𝑓 = 0.01, 𝑑𝑓 = 0.10, 𝑑𝑓 = 0.01, 𝑑𝑓 = 4, 𝜒 2 = 3, 𝜒 2 = 2, 𝜒 2 = 6, 𝜒 2 = 12.25 = 8.54 = 4.36 = 10.20 9. Say as much as you can about the P-value for an upper-tailed chi-squared test in each of the following situations. a. 𝜒 2 = 7.5, 𝑑𝑓 = 2 b. 𝜒 2 = 13.0, 𝑑𝑓 = 6 c. 𝜒 2 = 18.0, 𝑑𝑓 = 9 d. 𝜒 2 = 21.3, 𝑑𝑓 = 5 e. 𝜒 2 = 5.0, 𝑘 = 4 10. Criminologists have long debated whether there is a relationship between weather conditions and the incidence of violent crime. An article classified 1361 homicides according to season, resulting in the accompanying data. Test the null hypothesis of equal proportions using 𝛼 = 0.01 by using the chi-squared table to say as much as possible about the P-value. Winter Spring Summer Fall 328 334 372 327 11. Consider a large population of families in which each family has exactly three children. If the genders of the three children in any family are independent of one another, then number of male children in a randomly selected family will have a binomial distribution based on three trials. a. Suppose a random sample of 160 families yields the following results. Test the relevant hypotheses. Number of Male 0 1 2 3 Children Frequency 14 66 64 16 b. Suppose a random sample of families in a nonhuman population resulting in observed frequencies shown in the table below. Would the chi-squared test be based on the same number of degrees of freedom? Conduct the test. Number of Male 0 1 2 3 Children Frequency 15 20 12 3 12. Each individual in a random sample of high school students and college students was crossclassified with respect to both political views and marijuana usage, resulting in the data displayed in the accompanying two-way table. Does the data support the hypothesis that political views and marijuana usage level are independent within the population? Test the appropriate hypotheses using the level of significance 0.01. Usage Level Never Rarely Frequently Political Views Liberal 479 173 119 Conservative 214 47 15 Other 172 45 85 13. The accompanying data on degree of spirituality for samples of natural and social scientists at research universities as well as for a sample of non-academics with graduate degrees Degree of Spirituality Moderate 162 223 164 Very Slightly Not at all Natural Science 56 198 211 Social Science 56 243 239 Graduate 109 74 28 Degree a. Is there substantial evidence for concluding that the three types of individuals are not homogeneous with respect to their degree of spirituality? State and test the appropriate hypotheses. b. Considering just the natural scientists and social scientists, is there evidence for nonhomogeneity? Base your conclusion on a P-value.


