Sound Exam Questions: Mammal Hearing & Wave Properties
advertisement
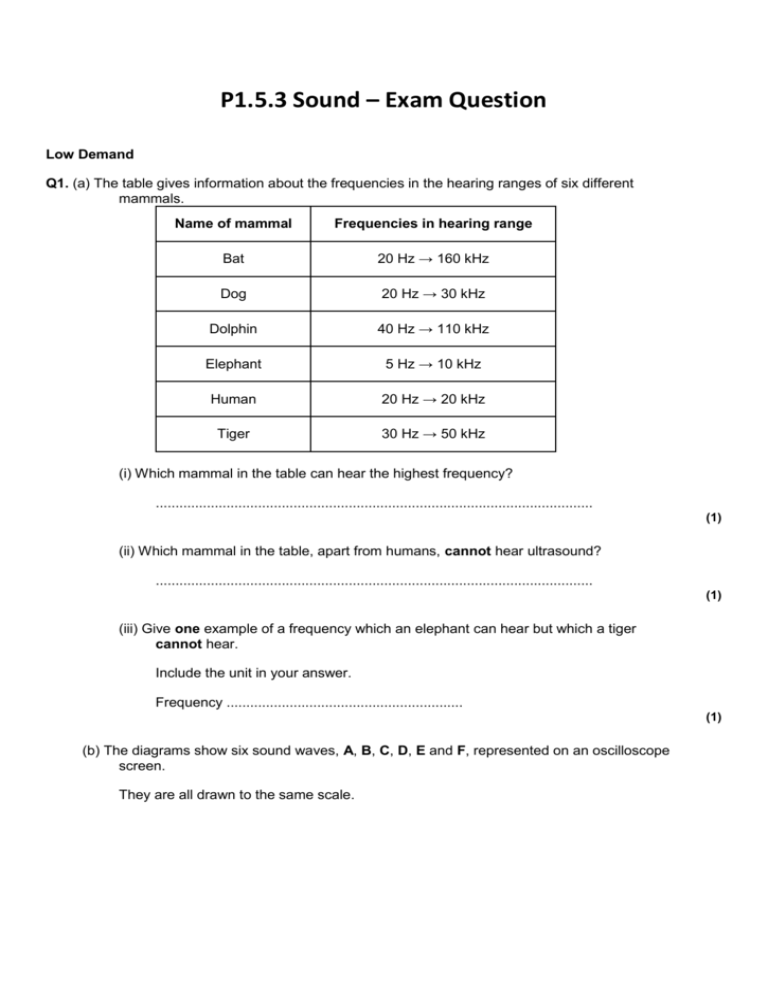
P1.5.3 Sound – Exam Question Low Demand Q1. (a) The table gives information about the frequencies in the hearing ranges of six different mammals. Name of mammal Frequencies in hearing range Bat 20 Hz → 160 kHz Dog 20 Hz → 30 kHz Dolphin 40 Hz → 110 kHz Elephant 5 Hz → 10 kHz Human 20 Hz → 20 kHz Tiger 30 Hz → 50 kHz (i) Which mammal in the table can hear the highest frequency? ............................................................................................................... (1) (ii) Which mammal in the table, apart from humans, cannot hear ultrasound? ............................................................................................................... (1) (iii) Give one example of a frequency which an elephant can hear but which a tiger cannot hear. Include the unit in your answer. Frequency ............................................................ (1) (b) The diagrams show six sound waves, A, B, C, D, E and F, represented on an oscilloscope screen. They are all drawn to the same scale. (i) Which one of the waves has the greatest amplitude? Wave ............................................................ . (1) (ii) Which one of the waves has the highest frequency? Wave ............................................................ . (1) (Total 5 marks) P1.5.3 Sound – Exam Question Low Demand Q2. A microphone and a cathode ray oscilloscope (CRO) can be used to show the pattern of a sound wave. Four sound wave patterns, A, B, C and D, are shown. They are all drawn to the same scale. (a) Which one of the patterns has the smallest amplitude? ..................................................... (b) Which one of the patterns has the lowest frequency? ........................................................ (Total 2 marks) Low Demand Q3. A hard, flat surface reflects sound just like a plane (flat) mirror reflects light. You want to hear the reflection (echo) of the ticking watch through a tube. Which is the best position to put the tube? Choose from positions A-E on the diagram ...................................................................... (You may draw on the diagram if you want to.) (Total 2 marks) P1.5.3 Sound – Exam Question – High Demand Q4. The diagram shows the oscilloscope traces of two different sounds P and Q. The oscilloscope setting is exactly the same in both cases. P and Q sound different. Write down two differences in the way they sound. Explain your answers as fully as you can. 1 ............................................................................................................................................ ............................................................................................................................................... ............................................................................................................................................... 2 ............................................................................................................................................ ............................................................................................................................................... ............................................................................................................................................... (Total 5 marks) M1. (a) (i) bat(s) 1 (ii) elephant(s) 1 (iii) any example in the inclusive range 5 ↔ 29 Hz / hertz appropriate number and unit both required 1 (b) (i) B 1 (ii) F 1 [5] M2. (a) C (only) 1 (b) A (only) 1 [2] M3. D gains 1 mark but E (D + E = 1) gains 2 marks [2] M4. • Q is louder • Q is higher (pitch/note but not frequency) [if loudness and pitch both mentioned but direction wrong / absent credit 1 mark] • louder because bigger amplitude/height • higher pitch because higher frequency/shorter wavelength/waves closer together • factor of 2 mentioned w.r.t either (NB converse answer for P) each • for 1 mark [5]
