Scientific Method VIP Notes - South Windsor Public Schools
advertisement

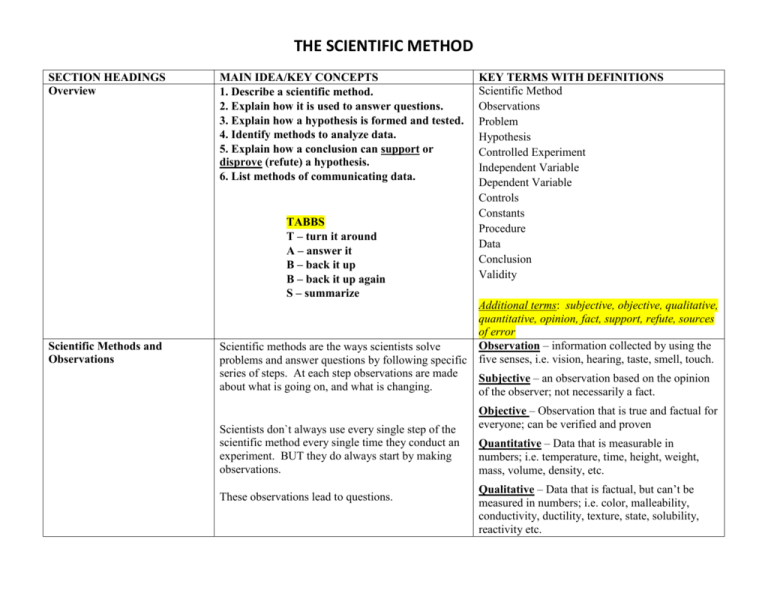
THE SCIENTIFIC METHOD SECTION HEADINGS Overview Scientific Methods and Observations MAIN IDEA/KEY CONCEPTS 1. Describe a scientific method. 2. Explain how it is used to answer questions. 3. Explain how a hypothesis is formed and tested. 4. Identify methods to analyze data. 5. Explain how a conclusion can support or disprove (refute) a hypothesis. 6. List methods of communicating data. TABBS T – turn it around A – answer it B – back it up B – back it up again S – summarize Scientific methods are the ways scientists solve problems and answer questions by following specific series of steps. At each step observations are made about what is going on, and what is changing. Scientists don`t always use every single step of the scientific method every single time they conduct an experiment. BUT they do always start by making observations. These observations lead to questions. KEY TERMS WITH DEFINITIONS Scientific Method Observations Problem Hypothesis Controlled Experiment Independent Variable Dependent Variable Controls Constants Procedure Data Conclusion Validity Additional terms: subjective, objective, qualitative, quantitative, opinion, fact, support, refute, sources of error Observation – information collected by using the five senses, i.e. vision, hearing, taste, smell, touch. Subjective – an observation based on the opinion of the observer; not necessarily a fact. Objective – Observation that is true and factual for everyone; can be verified and proven Quantitative – Data that is measurable in numbers; i.e. temperature, time, height, weight, mass, volume, density, etc. Qualitative – Data that is factual, but can’t be measured in numbers; i.e. color, malleability, conductivity, ductility, texture, state, solubility, reactivity etc. THE SCIENTIFIC METHOD Problem Forming a hypothesis Testing the Hypothesis The Problem Statement is based on questions asked after a series of initial observations and some background research. Describe the problem that you are trying to solve. Provide some explanation into the background or history of the problem. Problem - The idea the scientist is investigating in an experiment. The question the scientist is trying to answer; the solution he is trying to find. Why are you conducting the experiment (rationale), and what do you hope to learn (purpose)? (TABBS) “The application(s) to real life solution(s) is/are…” A hypothesis is a possible answer to a question; a prediction; an educated guess. A good hypothesis is testable. (TABBS) Sentence starters – “The reason(s) for conducting this experiment is/are ….” “We hope to learn who – what – when – where – why – how -…” Hypothesis - A testable idea or explanation that leads to a scientific explanation; it uses “if”, “then”, and “because.” Good example: “I predict that if I exercise then my pulse will speed up because my heart rate will increase.” Bad example: “Do these jeans make me look fat?” Sentence starter -“I predict that if we change …(IV)… then the result will be …(DV)… because (Scientific Principle)” After you form a hypothesis you must test it through a controlled experiment. This compares the results from the control (group) with the results from the tested (group). The groups are the same other than a variable. Independent Variable (I.V.) - The change manipulated by the scientist; the cause; the action taken. Procedure: A kind of ‘recipe’ for the experiment that so clear and specific that it can be repeated by someone else. First list all the materials, ingredients, tools, and measurements that will be needed. Follow this with a detailed step by step set of directions for the experiment. SOMETIMES A CONTROLLED EXPERIMENT IS NOT POSSIBLE. Dependent Variable (D.V.) - The change that takes place as a result of the Independent Variable; the effect; the reaction. Control - The group not affected by a change OR the Independent Variable BEFORE the first change. This serves as a starting point or a baseline measurement. Constants - Those things that must NEVER change during the course of the experiment such as the tools used to measure, the way they change is measured, or the surrounding environment in the lab. THE SCIENTIFIC METHOD Data All the information collected during the course of the experiment must be collected in a logical and consistent manner. Using data tables helps organize the results. (TABBS) This information should then be able to be transformed into a graph so that trends can be observed. Drawing conclusions Make sure all charts / tables / diagrams / drawings / graphs are well labeled and neat. Use a ruler and graph paper, or a graphing program. (TABBS) Analyze the results and determine whether or not they support the hypothesis. The conclusion begins by restating the hypothesis, and then stating whether it was supported or refuted by the data. Refer back to specific examples in the data, and explain any trends. Include any qualitative observations that may have affected the results. (TABBS) Explain if the experiment was well carried out and valuable; i.e. was it a fair test, were there at least three trials for each change in the independent variable, were all measurements consistent, were the constants maintained? State if the experiment was NOTE: AN EXPERIMENT completely valid, mostly valid, or invalid. Include CAN REFUTE YOUR HYPOTHESIS AND STILL BE possible sources of error. Did the experiment generate any new ideas or questions, or cause you to VALID. come up with a new hypothesis? State how you (TABBS) would improve the experiment if you were to do it again. Validity Data - Any pieces of information acquired through observations or experiments. Table - A chart of data showing the Independent Variable changes and the Dependent Variable Changes Graph - Diagram comparing I.V. and D.V. Must have an X axis and a Y axis – I.V. is on the X Axis and D.V. is on the Y Axis. Must include a title comparing I.V. to D.V.; each axis must be labeled and include the measurable units such as seconds, minutes, grams, meters etc.; must also include a key. Support – to agree with, or prove to be accurate or correct Refute - to disagree with, or to prove to be inaccurate or incorrect Sentence starters – “We predicted that if we changed …(IV)… then this result (DV) would occur … because of ….” “Our hypothesis was supported/refuted by the data in these ways…” “The graph shows that in fact….” “In addition we observed ...” “Therefore our hypothesis was supported/refuted by the data.” Sources of Error – Anything that may have influenced the accuracy of the data, including inconsistent measurements, accidents, changes in the constants, mistakes, not doing enough trials, not having enough controls or a big enough control group, etc. Sentence starters – “Our experiment was completely valid/mostly valid/ invalid because… “I did/did not have enough data in this lab …” “If I were to do this over again, I would …” “This generated many questions. I would like to know…”


