version B - Drake University
advertisement
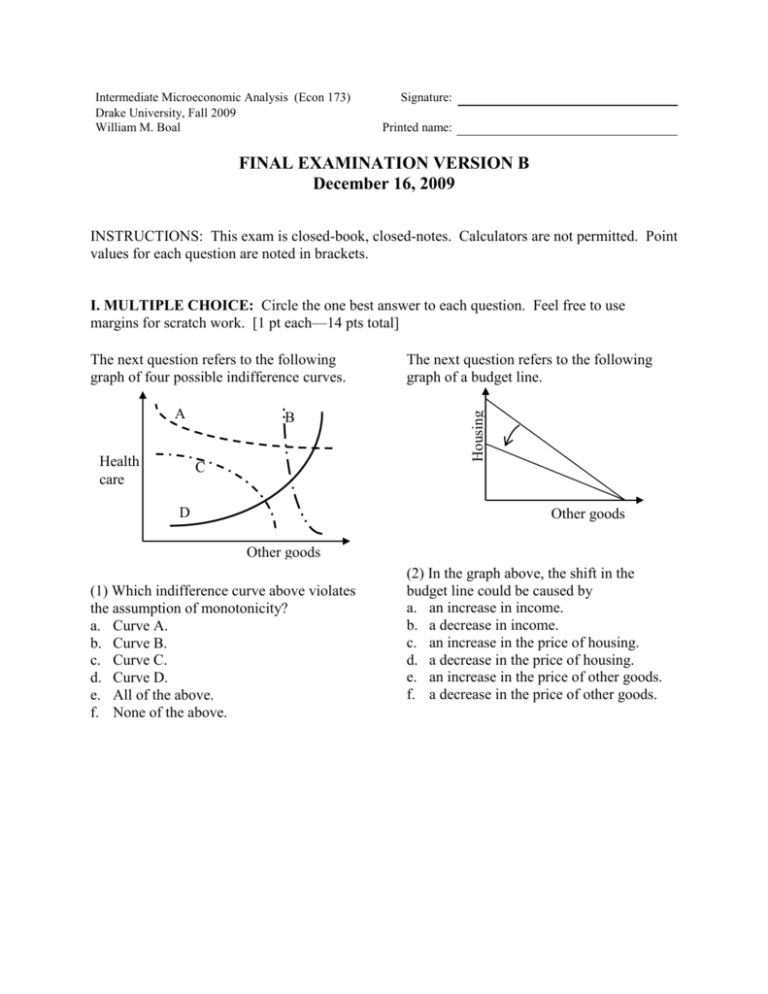
Intermediate Microeconomic Analysis (Econ 173) Drake University, Fall 2009 William M. Boal Signature: Printed name: FINAL EXAMINATION VERSION B December 16, 2009 INSTRUCTIONS: This exam is closed-book, closed-notes. Calculators are not permitted. Point values for each question are noted in brackets. I. MULTIPLE CHOICE: Circle the one best answer to each question. Feel free to use margins for scratch work. [1 pt each—14 pts total] A Health care B C D The next question refers to the following graph of a budget line. Housing The next question refers to the following graph of four possible indifference curves. Other goods Other goods (1) Which indifference curve above violates the assumption of monotonicity? a. Curve A. b. Curve B. c. Curve C. d. Curve D. e. All of the above. f. None of the above. (2) In the graph above, the shift in the budget line could be caused by a. an increase in income. b. a decrease in income. c. an increase in the price of housing. d. a decrease in the price of housing. e. an increase in the price of other goods. f. a decrease in the price of other goods. Intermediate Microeconomic Analysis (Econ 173) Drake University, Fall 2009 The next two questions refer to the following graph of a consumer's budget line and indifference curves. Suppose the consumer is currently at bundle A for some reason. Other goods = q1 A Energy = q2 (3) This consumer could enjoy higher utility, without increasing total spending, by a. purchasing less energy and more other goods. b. purchasing more energy and fewer other goods. c. purchasing less energy and fewer other goods. d. any of the above. e. none of the above. (4) Let MU1 denote the marginal utility of other goods and MU2 the marginal utility of energy for this consumer. Let p1 denote the price of other goods and p2 denote the price of energy. At bundle A, a. MU2 = MU1 and p2 = p1 . b. MU2/MU1 = p2/p1 . c. MU2/MU1 < p2/p1 . d. MU2/MU1 > p2/p1 . e. cannot be determined from information given. Final Examination Version B Page 2 of 12 (5) The production function q = 2 x11/4 x21/2 shows a. constant returns to scale. b. decreasing returns to scale. c. increasing returns to scale. d. cannot be determined from the information given. The next two questions refer to the following information. Suppose a firm’s long-run total cost function is given by TC(q) = 0.005q3 – 0.5 q2 + 20 q . (6) The firm’s marginal cost function is MC(q) = a. 0.01 q – 0.5 . b. 0.03 q – 1 . c. 0.005 q2 – 0.5 q + 20 . d. 0.015 q2 – q + 20 . e. 0.005q3 – 0.5 q2 + 20 q . (7) The firm’s average cost function is AC(q) = a. 0.01 q – 0.5 . b. 0.03 q – 1 . c. 0.005 q2 – 0.5 q + 20 . d. 0.015 q2 – q + 20 . e. 0.005q3 – 0.5 q2 + 20 q . (8) Price equals average cost in a. short-run competitive equilibrium. b. long-run competitive equilibrium. c. both short-run and long-run competitive equilibrium. d. none of the above. Intermediate Microeconomic Analysis (Econ 173) Drake University, Fall 2009 Pizza The next four questions refer to the following Edgeworth box diagram for consumption. The solid curves are Amanda's indifference curves. The dashed curves are Brian's indifference curves. Brian B C A Amanda Sodapop (9) From allocation B, both consumers can enjoy greater utility if a. Amanda gives Brian some pizza, and Brian gives Amanda some sodapop. b. Amanda gives Brian some sodapop, and Brian gives Amanda some pizza. c. Amanda gives Brian some pizza and some sodapop. d. Brian gives Amanda some pizza and some sodapop. e. No trade will allow both consumers to enjoy greater utility. (10) From allocation C, both consumers can enjoy greater utility if a. Amanda gives Brian some pizza, and Brian gives Amanda some sodapop. b. Amanda gives Brian some sodapop, and Brian gives Amanda some pizza. c. Amanda gives Brian some pizza and some sodapop. d. Brian gives Amanda some pizza and some sodapop. e. No trade will allow both consumers to enjoy greater utility. Final Examination Version B Page 3 of 12 (11) The contract curve for this Edgeworth box diagram does not pass through a. Allocation A. b. Allocation B. c. Allocation C. d. The contract curve passes through all three allocations. e. The contract curve does not pass through any of these three allocations. (12) A monopolist produces the same product for two market segments. Market segment A has an elasticity of demand of -3. Market segment B has an elasticity of demand of -8. Assume the monopolist can prevent arbitrage between the two market segments. To maximize profit, which market segment should get the higher price? a. Market segment A. b. Market segment B. c. Both market segments should get the same price because the marginal cost of the product is the same. d. Cannot be determined from the information given. (13) A public grazing area has limited ability to feed cattle. Suppose it is impossible to prevent people from using it for their cattle. Then the public grazing area is a. a nonrival good. b. a nonexcludable good. c. both a nonrival good and a nonexcludable good. d. neither a nonrival good nor a nonexcludable good. Intermediate Microeconomic Analysis (Econ 173) Drake University, Fall 2009 Final Examination Version B Page 4 of 12 (14) Suppose a housing development with 10 families is planted with flower beds in the median strip. The marginal benefit function of flower beds, for a typical family, is given by MB = 20 – 5Q, where Q denotes the number of flower beds. The marginal cost of each flower bed is $50. What is the socially-optimal number of flower beds for this housing development? a. b. c. d. e. f. zero. one flower bed. two flower beds. three flower beds. four flower beds. five flower beds. II. SHORT ANSWER: Please write your answers in the boxes on this question sheet. Use margins and graphs for scratch work. Food (1) [Substitution and income effects: 12 pts] Consider the indifference-curve diagram below. Assume the consumer has $60 income. 10 9 8 7 6 5 4 3 2 1 0 Old budget line New budget line Parallel to new budget line 0 1 2 3 4 5 6 7 8 9 10 Other goods a. Given the old budget line, how much food does the consumer demand? b. Compute the change in quantity of food demanded due to the substitution effect: qsub . c. Compute the change in quantity of food demanded due to the income effect: qinc . units units units Intermediate Microeconomic Analysis (Econ 173) Drake University, Fall 2009 Final Examination Version B Page 5 of 12 (2) [Price elasticity of demand: 10 pts] Suppose the price elasticity of demand for electricity is –1.2, and the electric utility raises its rates by 5 %. a. Is the demand for electricity elastic or inelastic ? b. Will the quantity demanded of electricity increase or decrease? c. By about how much? % d. Will the revenue received by the electric utility increase or decrease? e. By about how much? % Dollars per unit of output (3) [Short-run cost curves and supply: 10 pts] The following graph shows Acme Manufacturing Company’s short-run average total cost (SATC), short-run average variable cost (SAVC), and short-run marginal cost (SMC). Assume Acme takes its market price as given. $18 $17 $16 $15 $14 $13 $12 $11 $10 $9 $8 $7 $6 $5 $4 $3 $2 $1 $0 0 100 200 300 400 500 600 700 800 900 1000 1100 1200 1300 1400 1500 1600 Quantity of output SMC SAVC SATC a. If the market price is $7, about how much output will Acme try to produce? Give an answer to the nearest 100. b. If the market price is $16, about how much output will Acme try to produce? Give an answer to the nearest 100. c. If the market price is $4, about how much output will Acme try to produce? Give an answer to the nearest 100. d. What is Acme's breakeven price—that is, the lowest price at which Acme will avoid losses in the short run? e. What is Acme's shutdown price—that is, the lowest price at which Acme will continue to operate in the short run? units units units $ $ Intermediate Microeconomic Analysis (Econ 173) Drake University, Fall 2009 Final Examination Version B Page 6 of 12 (4) [Marginal revenue: 6 pts] Suppose an ice cream vendor with market power is now selling 20 ice cream cones per hour at a price of $2.00. If she cuts the price to $1.95, she can sell one more cone per hour (that is, a total of 21 cones per hour). a. Compute the vendor's marginal revenue for the 21st cone. $ Suppose the marginal cost of producing ice cream is $1.00 per cone, and suppose the vendor does lower her price to $1.95 to sell 21 cones per hour. b. Will the vendor's hourly profit increase or decrease? c. By how much? $ (5) [Controlling pollution: 10 pts] Suppose two factories are producing pollution (Q). The old factory has marginal benefit from pollution (reflecting increased profit) given by the equation Qold = 100 – 10 MB. The new factory has marginal benefit from pollution given by the equation Qnew = 50 – 5 MB. a. If there is no penalty for pollution, how much pollution will the two factories produce, in total? Now suppose the government has determined that pollution must be reduced to Qtot=60 units. It has created 60 permits to emit one unit of pollution and will sell them at auction. b. Compute the equilibrium auction price of a pollution permit. $ [Hint: the equilibrium price is the price where the total number of permits demanded by the two factories equals the number of available permits.] c. How many permits will the old factory buy? permits d. How many permits will the new factory buy? permits Alternatively, instead of selling permits, suppose the government decides to impose an emission fee to reduce pollution. Its goal is still to reduce pollution to Qtot=60 units. e. What emission fee per unit of pollution will induce the $ factories to produce only 60 units of pollution? III. PROBLEMS: Please write your answers in the boxes on this question sheet. Show your work and circle your final answers. Intermediate Microeconomic Analysis (Econ 173) Drake University, Fall 2009 Final Examination Version B Page 7 of 12 (1) [Individual demand: 9 pts] A consumer has the following utility function: U(q1,q2) = q1 (q2 + 4) , where q1 denotes the quantity of energy and q2 denotes the quantity of other goods. a. [3 pts] Find a formula for the consumer’s marginal rate of substitution of other goods for energy—that is, the |slope| of the consumer’s indifference curve with energy on the vertical axis and other goods on the horizontal axis. The variables q1 and q2 should be the only unknowns. Circle your final answer. Let p1 denote the price of energy and let p2 denote the price of other goods. Let I denote the consumer's income. b. [3 pts] Solve for the consumer's demand function for energy—that is the formula showing q1* as a function of p1, p2, and I. Show your work and circle your final answer. [Hint: check that your answer is homogeneous of degree zero.] c. [3 pts] Solve for the consumer's demand function for other goods—that is the formula showing q2* as a function of p1, p2, and I. Show your work and circle your final answer. [Hint: check that your answer is homogeneous of degree zero.] Intermediate Microeconomic Analysis (Econ 173) Drake University, Fall 2009 Final Examination Version B Page 8 of 12 (2) [Welfare analysis of international trade: 10 pts] Suppose domestic demand and supply for a good are given by the following equations. Demand: QD = 300 – 20 P Supply: QS = 40 P – 60 . First consider the domestic market without international trade. a. Compute the equilibrium quantity? b. Compute the equilibrium price. units $ Now suppose the market is opened to international trade, and the world price of the good turns out to be $5 . (Use the graph below for scratch work.) c. Will the country now import or export the good? d. How much? units $ g. Will producer surplus increase or decrease as a result of international trade? h. By how much? $ i. Will total social welfare in the country increase or decrease as a result of international trade? j. By how much? $ Price e. Will consumer surplus increase or decrease as a result of international trade? f. By how much? Quantity Intermediate Microeconomic Analysis (Econ 173) Drake University, Fall 2009 Final Examination Version B Page 9 of 12 (3) [Cournot duopoly: 14 pts] Suppose two firms form a symmetric Cournot duopoly, each firm setting its own quantity while taking the other firm’s quantity as given. Let q1 = firm #1’s quantity and q2 = firm #2’s quantity, so that total market quantity Q = q1 + q2 . The market demand curve is P = 15 – (Q/10). Each firm has constant marginal and average cost equal to $3. Circle your final answers. Use the space at the bottom of the next page for scratch work. Note: question continues on next page. a. Find an expression for firm #1's revenue, as a function of its own quantity and the quantity produced by the other firm: Rev1(q1,q2). [Hint: By definition, Rev1 = P q1. Here, replace P by the equation for the demand curve, and then replace Q by (q1 + q2).] b. Find an expression for firm #1's marginal revenue, as a function of its own quantity and the quantity produced by the other firm: MR1(q1,q2). [Hint: MR1(q1,q2) = Rev1(q1,q2) / q1.] c. Find an expression for firm #1's reaction function, showing how much firm #1 will produce for any given level of quantity set by the other firm: q1* = f(q2). [Hint: Set MR1 = MC and solve for q1 as a function of q2 .] d. Assume the equilibrium is symmetric (that is, assume q1* = q2*) and compute firm #1's equilibrium quantity q1*. Intermediate Microeconomic Analysis (Econ 173) Drake University, Fall 2009 Final Examination Version B Page 10 of 12 e. Compute total market quantity Q* and the equilibrium price P*. f. Compute the total profit of both firms. Price g. Compute the social deadweight loss. Quantity Intermediate Microeconomic Analysis (Econ 173) Drake University, Fall 2009 Final Examination Version B Page 11 of 12 (4) [External benefit and Pigou subsidy: 8 pts] Suppose supply and demand for a particular vaccine are given by the following equations. Use the space at the bottom of this page for scratch work. Demand: PD = 20 – (Q/100) Supply: PS = 2 + (Q/100). a. Compute the unregulated equilibrium price and quantity. Persons who are vaccinated lower the risk of disease to everyone around them, creating an external benefit. Marginal external benefit per vaccine is estimated to be MEB = 12 — (Q/200). b. Find a formula for the marginal social benefit of the vaccine. c. Compute the socially-optimal quantity of vaccinations. Price d. Compute the Pigou subsidy rate on this vaccine, in dollars per unit, that would result in the socially-optimal quantity of vaccinations. Quantity Intermediate Microeconomic Analysis (Econ 173) Drake University, Fall 2009 Final Examination Version B Page 12 of 12 IV. CRITICAL THINKING: Answer just one of the questions below (your choice). [3 pts] (1) Suppose supply of a good is perfectly elastic. If the good is taxed, who bears the burden of the tax—buyers, sellers, or both? Justify your answer with a supply-and-demand graph. (2) Suppose a consumer normally buys 20 gallons of gasoline per month at a price of $3. Which would this consumer prefer: a reduction in price from $3 to $1, or an increase in income of $40 ? Justify your answer with a graph of a demand curve. Circle the question you are answering and write your answer below. Full credit requires good grammar, accurate spelling, and correct economic reasoning. [end of exam]
