version B - Drake University
advertisement
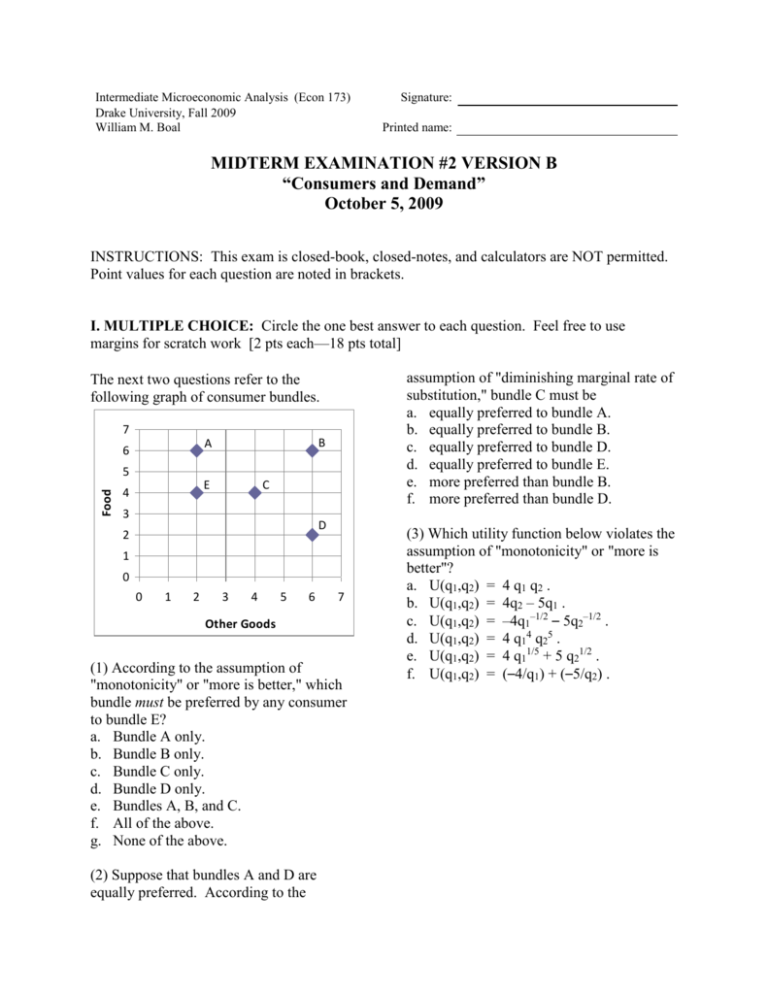
Intermediate Microeconomic Analysis (Econ 173) Drake University, Fall 2009 William M. Boal Signature: Printed name: MIDTERM EXAMINATION #2 VERSION B “Consumers and Demand” October 5, 2009 INSTRUCTIONS: This exam is closed-book, closed-notes, and calculators are NOT permitted. Point values for each question are noted in brackets. I. MULTIPLE CHOICE: Circle the one best answer to each question. Feel free to use margins for scratch work [2 pts each—18 pts total] assumption of "diminishing marginal rate of substitution," bundle C must be a. equally preferred to bundle A. b. equally preferred to bundle B. c. equally preferred to bundle D. d. equally preferred to bundle E. e. more preferred than bundle B. f. more preferred than bundle D. The next two questions refer to the following graph of consumer bundles. 7 B A 6 Food 5 E 4 C 3 D 2 1 0 0 1 2 3 4 5 6 7 Other Goods (1) According to the assumption of "monotonicity" or "more is better," which bundle must be preferred by any consumer to bundle E? a. Bundle A only. b. Bundle B only. c. Bundle C only. d. Bundle D only. e. Bundles A, B, and C. f. All of the above. g. None of the above. (2) Suppose that bundles A and D are equally preferred. According to the (3) Which utility function below violates the assumption of "monotonicity" or "more is better"? a. U(q1,q2) = 4 q1 q2 . b. U(q1,q2) = 4q2 – 5q1 . c. U(q1,q2) = –4q1–1/2 – 5q2–1/2 . d. U(q1,q2) = 4 q14 q25 . e. U(q1,q2) = 4 q11/5 + 5 q21/2 . f. U(q1,q2) = (–4/q1) + (–5/q2) . Intermediate Microeconomic Analysis (Econ 173) Drake University, Fall 2009 A Health care D B C Other goods (4) Which indifference curve above violates the assumption of monotonicity? a. Curve A. b. Curve B. c. Curve C. d. Curve D. e. All of the above. f. None of the above. The next question refers to the following graph of four possible indifference curves. D C Health care B A Other goods (5) Which indifference curve above violates the assumption of diminishing marginal rate of substitution? a. Curve A. b. Curve B. c. Curve C. d. Curve D. e. All of the above. f. None of the above. (6) Which utility function below violates the assumption of "diminishing marginal rate of substitution"? Assume that q1 > 4 and that q2 > 5. a. U(q1,q2) = (q1–2)(q2–3) . b. U(q1,q2) = q12 q23 . c. U(q1,q2) = –2/q1 – 3/q2 . d. U(q1,q2) = 2q1 + 3q2 . e. All of the above. f. None of the above. The next question refers to the following graph of a budget line. Housing The next question refers to the following graph of four possible indifference curves. Midterm Examination #2 Version B Page 2 of 9 Other goods (7) In the graph above, the shift in the budget line could be caused by a. an increase in income. b. a decrease in income. c. an increase in the price of housing. d. a decrease in the price of housing. e. an increase in the price of other goods. f. a decrease in the price of other goods. Intermediate Microeconomic Analysis (Econ 173) Drake University, Fall 2009 The next two questions refer to the following graph of a consumer's budget line and indifference curves. Suppose the consumer is currently at bundle A for some reason. Other goods = q1 A Energy = q2 Midterm Examination #2 Version B Page 3 of 9 (8) This consumer could enjoy higher utility, without increasing total spending, by a. purchasing less energy and more other goods. b. purchasing more energy and fewer other goods. c. purchasing less energy and fewer other goods. d. any of the above. e. none of the above. (9) Let MU1 denote the marginal utility of other goods and MU2 the marginal utility of energy for this consumer. Let p1 denote the price of other goods and p2 denote the price of energy. At bundle A, a. MU2 = MU1 and p2 = p1 . b. MU2/MU1 = p2/p1 . c. MU2/MU1 < p2/p1 . d. MU2/MU1 > p2/p1 . e. cannot be determined from information given. II. SHORT ANSWER: Please write your answers in the boxes on this question sheet. Feel free to use margins for scratch work. (1) [Budget line: 6 pts] Suppose the price of food is $3 and the price of other goods is $2. Suppose a consumer has $120 to spend on these two goods. Consider the consumer's budget line, with food on the vertical axis and other goods on the horizontal axis. a. What is the budget line's intercept on the food axis? units of food b. What is the budget line's intercept on the other-goods axis? c. What is the slope of the budget line with food on the vertical axis and other goods on the horizontal axis? units of other goods Intermediate Microeconomic Analysis (Econ 173) Drake University, Fall 2009 Midterm Examination #2 Version B Page 4 of 9 (2) [Slutsky equation: 8 pts] Suppose Consumer X buys a bundle of consumer goods including 10 pounds of hamburger per month. Then the price of hamburger rises from $2 to $4. a. Assume that the partial derivative of Consumer X's demand pounds for hamburger with respect to the price of hamburger is –3. Compute the approximate total decrease in hamburger purchased by Consumer X due to the price increase. b. How much would Consumer X's income have to increase so $ that Consumer X could still just afford the old bundle? c. Assume that the partial derivative of Consumer X's demand pounds for hamburger with respect to income is 0.025. Compute the approximate decrease in hamburger purchased due to the income effect alone. d. Compute the approximate decrease in hamburger purchased pounds due to the substitution effect alone. Other goods (3) [Substitution and income effects: 12 pts] Consider the indifference-curve diagram below. Assume the consumer has $30 income. 10 9 8 7 6 5 4 3 2 1 0 Old budget line New budget line Parallel to new budget line 0 1 2 3 4 5 6 7 8 9 10 Energy a. What was the price of energy on the old budget line? b. Given the old budget line, how much energy does the consumer demand? c. What is the price of energy on the new budget line? d. Given the new budget line, how much energy does the consumer demand? e. Compute the change in quantity of energy demanded due to the substitution effect: qsub . f. Compute the change in quantity of energy demanded due to the income effect: qinc . $ units $ units units units Intermediate Microeconomic Analysis (Econ 173) Drake University, Fall 2009 Midterm Examination #2 Version B Page 5 of 9 (4) [Cost-of-living indexes: 6 pts] Suppose we are given the following data on prices and quantities consumed of food and other goods. Food Price $5 $5 Old period New period Other goods Price Quantity $5 4 units $8 5 units Quantity 6 units 15 units a. Compute the Laspeyres cost-of-living index in the new period. b. Compute the Paasche cost-of-living index in the new period. c. Give a formula for the Fisher cost-of-living index in the new period. (5) [Consumer welfare: 6 pts] The following graph shows the ordinary and compensated demand for a good. $9 $8 $7 Price $6 $5 Ordinary demand $4 $3 Compensated demand $2 $1 $0 0 10 20 30 40 50 60 70 80 90 Quantity Suppose the price of the good rises from $1 to $7. a. Are consumers better off or worse off? b. Compute the change in consumer surplus. $ c. Compute the compensating variation in income. $ Intermediate Microeconomic Analysis (Econ 173) Drake University, Fall 2009 Midterm Examination #2 Version B Page 6 of 9 (6) [Price elasticity of demand: 10 pts] Suppose the price elasticity of demand for electricity is –1.2, and the electric utility raises its rates by 5 %. a. Is the demand for electricity elastic or inelastic ? b. Will the quantity demanded of electricity increase or decrease? c. By about how much? % d. Will the revenue received by the electric utility increase or decrease? e. By about how much? % (7) [Income elasticity of demand: 10 pts] Suppose that a consumer's income rises by 5%, and the income elasticity of demand for entertainment is 1.8 . a. Is entertainment an inferior good, a necessary good, or a luxury or superior good? b. Will the quantity demanded of entertainment increase or decrease? c. By about how much? % d. Will the share of the consumer's budget devoted to entertainment increase or decrease? e. By about how much? % Intermediate Microeconomic Analysis (Econ 173) Drake University, Fall 2009 Midterm Examination #2 Version B Page 7 of 9 IV. PROBLEMS: Please write your answers in the boxes on this question sheet. Show your work and circle your final answers. (1) [Budgets and choice: 12 pts] A consumer has the following utility function: U(q1,q2) = q12 (q2 + 5), where q1 denotes the quantity of hamburgers and q2 denotes the quantity of other goods. The price of hamburgers is $6 and the price of other goods is $5. The consumer has $155 in income to spend on these items. a. [4 pts] Give an equation for the consumer’s budget line. The variables q1 and q2 should be the only unknowns. b. [4 pts] Find a formula for the consumer’s marginal rate of substitution of other goods for hamburgers—that is, the |slope| of the consumer’s indifference curve with hamburgers on the vertical axis and other goods on the horizontal axis. The variables q1 and q2 should be the only unknowns. Circle your final answer. c. [4 pts] Solve for the quantities of hamburgers (q1*) and other goods (q2*) that this consumer will choose. Circle your final answers. Intermediate Microeconomic Analysis (Econ 173) Drake University, Fall 2009 Midterm Examination #2 Version B Page 8 of 9 (2) [Individual demand: 9 pts] A consumer has the following utility function: U(q1,q2) = (q1 2) q2 , where q1 denotes the quantity of energy and q2 denotes the quantity of other goods. a. [3 pts] Find a formula for the consumer’s marginal rate of substitution of other goods for energy—that is, the |slope| of the consumer’s indifference curve with energy on the vertical axis and other goods on the horizontal axis. The variables q1 and q2 should be the only unknowns. Circle your final answer. Let p1 denote the price of energy and let p2 denote the price of other goods. Let I denote the consumer's income. b. [3 pts] Solve for the consumer's demand function for energy—that is the formula showing q1* as a function of p1, p2, and I. Show your work and circle your final answer. [Hint: check that your answer is homogeneous of degree zero.] c. [3 pts] Solve for the consumer's demand function for other goods—that is the formula showing q2* as a function of p1, p2, and I. Show your work and circle your final answer. [Hint: check that your answer is homogeneous of degree zero.] Intermediate Microeconomic Analysis (Econ 173) Drake University, Fall 2009 Midterm Examination #2 Version B Page 9 of 9 III. CRITICAL THINKING: Answer just one of the questions below (your choice). [3 pts] (1) Suppose a consumer's demand function for good 1 takes the following form: q1 * 27 p1 p2 I , where p1 is the good's own price, p2 is the price of another good, and I is the consumer's income. If the demand for good 1 is homogeneous of degree zero in all prices and income, then what must be the value of the sum of the exponents: ( + α + ) ? Justify your answer with algebra. (2) Suppose a consumer normally buys 20 gallons of gasoline per month at a price of $3. Which would this consumer prefer: a reduction in price from $3 to $1, or an increase in income of $40 ? Justify your answer with a graph of a demand curve. Circle the question you are answering and write your answer below. Full credit requires good grammar, accurate spelling, and correct reasoning. [end of exam]


