666FL - SCIENCE CHINA Life Sciences
advertisement
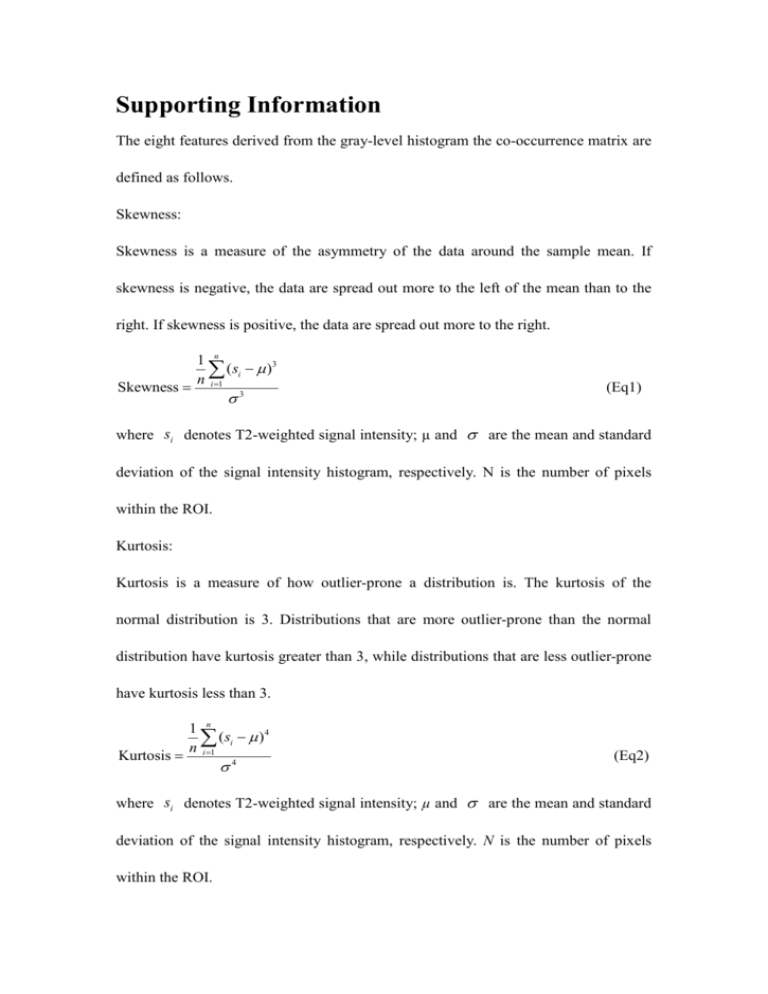
Supporting Information The eight features derived from the gray-level histogram the co-occurrence matrix are defined as follows. Skewness: Skewness is a measure of the asymmetry of the data around the sample mean. If skewness is negative, the data are spread out more to the left of the mean than to the right. If skewness is positive, the data are spread out more to the right. Skewness 1 n ( si )3 n i 1 3 (Eq1) where si denotes T2-weighted signal intensity; µ and are the mean and standard deviation of the signal intensity histogram, respectively. N is the number of pixels within the ROI. Kurtosis: Kurtosis is a measure of how outlier-prone a distribution is. The kurtosis of the normal distribution is 3. Distributions that are more outlier-prone than the normal distribution have kurtosis greater than 3, while distributions that are less outlier-prone have kurtosis less than 3. Kurtosis 1 n ( si ) 4 n i 1 4 (Eq2) where si denotes T2-weighted signal intensity; µ and are the mean and standard deviation of the signal intensity histogram, respectively. N is the number of pixels within the ROI. GLCM is the statistical method of examining the textures that considers the spatial relationship of the pixels. This method calculates the GLCM of each image by computing how often a pixel with a certain intensity i occurs in relation with another pixel j at a certain distance d and orientation θ. P (i, j ) V i, j G 1 G 1 (Eq3) V i 0 j 0 i, j The number of columns (j) and rows (i) is equal to the number of gray levels (G) used in image and each matrix element V(i, j), the value of cell (i, j), is normalized as P(i, j). The features extracted from GLCM are as following: Contrast: Contrast is a measure of the intensity contrast between a pixel and its neighbor over the whole image. G 1 G 1 Contrast i j P(i, j ) 2 (Eq4) i 0 j 0 Correlation: Correlation is a measure of how correlated a pixel is to its neighbor over the whole image. G 1 G 1 (i i )( j j ) P(i, j ) i 0 j 0 i j Correlation G 1 G 1 where i iP(i, j ) , i 0 j 0 G 1 G 1 j ( j j ) P(i, j ) . i 0 j 0 G 1 G 1 j jP(i, j ) , i 0 j 0 (Eq5) G 1 G 1 i (i i ) P(i, j ) , i 0 j 0 Energy: Contrast is the sum of squared elements in the GLCM. G 1 G 1 Energy P(i, j )2 (Eq6) i 0 j 0 Homogeneity: Homogeneity is a value that measures the closeness of the distribution of elements in the GLCM to the GLCM diagonal. G 1 G 1 Homogeneity i 0 j 0 P(i, j ) 1 i j 2 (Eq7) Entropy: Entropy is a statistical measure of randomness that can be used to characterize the texture of the input image. G 1 G 1 Entropy [ P(i, j ) log 2 ( P(i, j ))]2 i 0 j 0 (Eq8)

