Appendix B. - BioMed Central
advertisement

Appendix B
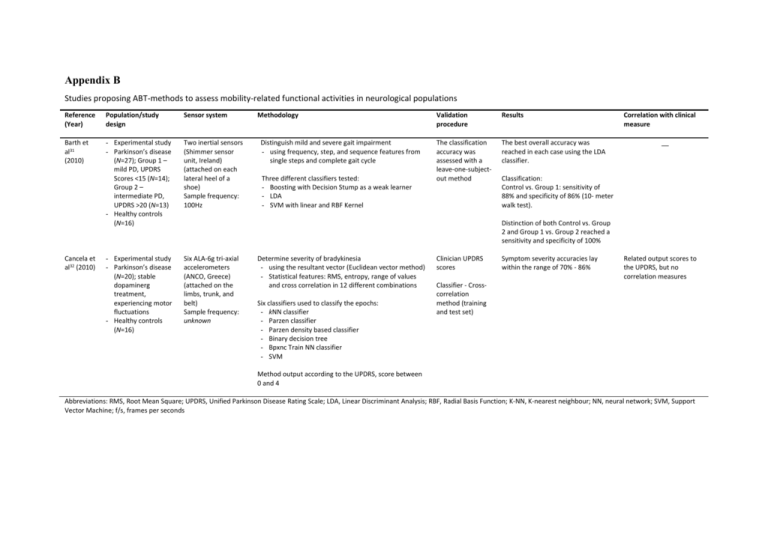
Studies proposing ABT-methods to assess mobility-related functional activities in neurological populations
Reference
(Year)
Population/study
design
Sensor system
Barth et
al31
(2010)
- Experimental study
- Parkinson’s disease
(N=27); Group 1 –
mild PD, UPDRS
Scores <15 (N=14);
Group 2 –
intermediate PD,
UPDRS >20 (N=13)
- Healthy controls
(N=16)
Two inertial sensors
(Shimmer sensor
unit, Ireland)
(attached on each
lateral heel of a
shoe)
Sample frequency:
100Hz
- Experimental study
- Parkinson’s disease
(N=20); stable
dopaminerg
treatment,
experiencing motor
fluctuations
- Healthy controls
(N=16)
Six ALA-6g tri-axial
accelerometers
(ANCO, Greece)
(attached on the
limbs, trunk, and
belt)
Sample frequency:
unknown
Cancela et
al32 (2010)
Methodology
Distinguish mild and severe gait impairment
- using frequency, step, and sequence features from
single steps and complete gait cycle
Three different classifiers tested:
- Boosting with Decision Stump as a weak learner
- LDA
- SVM with linear and RBF Kernel
Validation
procedure
Results
The classification
accuracy was
assessed with a
leave-one-subjectout method
The best overall accuracy was
reached in each case using the LDA
classifier.
Correlation with clinical
measure
__
Classification:
Control vs. Group 1: sensitivity of
88% and specificity of 86% (10- meter
walk test).
Distinction of both Control vs. Group
2 and Group 1 vs. Group 2 reached a
sensitivity and specificity of 100%
Determine severity of bradykinesia
- using the resultant vector (Euclidean vector method)
- Statistical features: RMS, entropy, range of values
and cross correlation in 12 different combinations
Six classifiers used to classify the epochs:
- kNN classifier
- Parzen classifier
- Parzen density based classifier
- Binary decision tree
- Bpxnc Train NN classifier
- SVM
Clinician UPDRS
scores
Symptom severity accuracies lay
within the range of 70% - 86%
Related output scores to
the UPDRS, but no
correlation measures
Classifier - Crosscorrelation
method (training
and test set)
Method output according to the UPDRS, score between
0 and 4
Abbreviations: RMS, Root Mean Square; UPDRS, Unified Parkinson Disease Rating Scale; LDA, Linear Discriminant Analysis; RBF, Radial Basis Function; K-NN, K-nearest neighbour; NN, neural network; SVM, Support
Vector Machine; f/s, frames per seconds
Studies proposing ABT-methods to assess mobility-related functional activities in neurological populations
Reference
(Year)
Population/study
design
Dobkin et
al33 (2011)
-
Pilot study
Stroke (N=12)
Healthy controls
(N=6)
Sensor system
Methodology
Validation
procedure
Results
Two tri-axial
accelerometers
(unknown) (attached
above the ankle)
Sample frequency:
320Hz
Detection and activity classification
- NB classifier
Stopwatch
measures,
observer step
counts, and
activity logs
Concurrent validity comparison
between stopwatch timed and
algorithm-derived outdoor walking
speeds, as well as their relationship
to the indoor walking speeds
Features: vector derived from frequencies, amplitudes,
and waveforms of accelerations and decelerations, and
time averages and derivatives
-
Motoi et
al39 (2005)
-
Experimental
study
Parkinson’s
disease (N=7)
Healthy controls
(N=10)
Experimental
study
Stroke (N=14)
Healthy controls
(N=11)
Abbreviations: NB, Naive Bayes
One inertial sensor
(MT9, Xsens, The
Netherlands)
(attached on the
shank)
Sample frequency:
unknown
Two dual-axial
accelerometers
(ACA302, Star
Micronics) and one
inertial sensor (dualaxis acc. + single axis
gyro [ENC-03J,
Murata]) (attached
on the sternum,
thigh and calf)
Sample frequency:
25Hz
Estimation of stride length by proposing a novel steplength algorithm based on the vertical acceleration and
pitch angular velocity
- Least-square error fit
Pen technique
Comparison to
video recordings
Detection of dynamic and static posture changes
Comparison to
video recordings
30f/s
Motion characteristics:
- Angle changes in sagittal plane
- Walking speed
__
Walking speed
Stroke group:
- Pearson correlation outdoor
walking speed r = .98 (p= .001)
- Retest-reliability for repeated
walks was high (p =.01)
Healthy group:
- Pearson correlation r = .98 (p=
.001)
- Gaussian discretization of features into model-free
clusters, followed by maximum likelihood
estimation for real classification
Moore et
al38 (2007)
Correlation with clinical
measure
Activity detection
- All periods of mobility and lower
extremity exercise were
correctly categorized in healthy
and stroke subjects
Accuracy stride monitor estimation,
mean error 0.05m
Comparison wearable system
accuracy against video recordings
- Walking speed; r=.992
- Angle change; r=.997
Comparison rehabilitation program
before and after (no data presented)
- Before: more fluctuations
maximum values angle changes
- After: higher repeatability in
detecting maximum values
__
__
Studies proposing ABT-methods to assess mobility-related functional activities in neurological populations
Reference
(Year)
Population/study
design
Lau et al34
(2009)
-
-
Experimental
study,
observational
classifier
Stroke (N=7)
No Control group
Sensor system
Methodology
Validation
procedure
Results
Two inertial sensors
(one attached to the
shank and one to the
foot)
Sample frequency:
240 Hz
Test the performance of three different SVM classifiers
(SVM, MLP, and RBF) – under 5 different walking
conditions
(i.e. stair ascent, stair descent, level ground walking,
upslope and downslope treadmill walking)
- 4 Classification tasks:
- 5-class (all conditions separately)
- 3-class (stair ascent, stair descent, and combined
[level slope walking])
Dataset: 50%
training set and
50% testing set
The SVM technique always
performed better than MLP and RBF
Correlation with clinical
measure
__
The overall accuracy increased from
92.9% to 96.8% in 3-class
classification for a group and for an
individual
Feature extraction, dataset variables:
- Sh(AVps) – pre-swing phase
- Sh(Accps) – pre-swing phase
- Ft(Accps) – pre-swing phase
- Sh(Accis) – initial swing phase
- Ft (Accis) – initial swing phase
Dataset 1: Shank variables
Dataset 2: Foot variables
Dataset 3: Shank and foot variables
Salarian
et al42
(2007)
-
Experimental
study
Parkinson’s
disease (N=10)
Healthy controls
(N=10)
Three inertial
sensors (one
attached to the
trunk, two to the
shanks)
Sampling frequency:
200Hz
Detection and classification of transition
Parameters used:
- TD (s)
- Min (θg-lp)
- Range(θg-lp)
- Range(atrunk-lp), Max(atrunk-lp), Min(atrunk-lp), t{Min(atrunklp)}, t{Max(atrunk-lp)}
Separate transitions from non-transitions
- two statistical classifiers based on logistic regression
model
Classification of the activities
- implemented a fuzzy classification method (6 fuzzy
variables used)
Video comparison,
event detection
Face to face
validity with the
UPDRS
Trained method
(transition/nontransition): 70%
data set
(randomly) and
30% used for
evaluation of
outcomes
Detection of posture transitions,
compared to video recording as a
reference
- Sensitivity 94.4% (Controls) and
83.8 (PD)
- Specificity 96.9% (Controls) and
87.0% (PD)
Significant correlation
(p<.05) with the UPDRS:
- TD, r= .64
- Max(atrunk-lp), r=-.55
- Min(atrunk-lp), r=.69
- Range(atrunk-lp), r=-.65
Classification of basic activities (i.e.
walking, standing, sitting, and lying
- Sensitivity controls - walking
(99.1%), standing (96.1%), sitting
(99.5%), and lying (100%)
- Sensitivity PD- walking (98.5%),
standing (83.6%), sitting (86.3%),
and lying (91.8%)
Abbreviations: UPDRS, Unified Parkinson Disease Rating Scale; TD, duration or transition, defined as time interval between two peaks; Min (θg-lp), amplitude negative peak trunk flexion/extension; Range(θg-lp), range
of antero-posterior tilt of the trunk; Range(atrunk-lp), Max(atrunk-lp), Min(atrunk-lp), t{Min(atrunk-lp)}, t{Max(atrunk-lp)}, the norm of the acceleration vector of the trunk sensor; SVM,Support Vector Machine; MLP, Neural
network using multi-layer perceptron; RBF, radial basis function network; Sh(AVps), shank angular velocity, Sh(Accps), amplitude values of the anterior-posterior acceleration
Studies proposing ABT-methods to assess mobility-related functional activities in neurological populations
Reference
(Year)
Population/study
design
Yang et
al43 (2011)
-
-
Zwartjes
et al45
(2010)
-
-
Sensor system
Methodology
Validation
procedure
Results
Experimental
study
Parkinson’s
disease (N=5);
H&Y stage II and III
Healthy controls
(N=5)
One tri-axial
accelerometer
(Kionix,KXPA4-2050)
(attached to the
trunk)
Sample frequency:
50Hz
Autocorrelation procedure
Cadence
validation through
video recordings
Cadence validation:
Mean absolute percentage error
4.89%
Clinical trial with
control group
Parkinson’s disease
(N=6); sensitive to
DBS treatment
(<5min), no major
motor fluctuations
due to medication
Healthy controls
(N=7)
Four inertial MT9
sensors (Xsens
Technologies, The
Netherlands)
(attached on the
trunk, wrist, thigh
and foot of the MAS)
Sample frequency:
50Hz
Classify motor activity
- AC to differentiate between lying, sitting, standing,
standing up, and walking
- Binary decision nodes: 7 nodes to discriminate
activities
Feature extraction for particular nodes
1 IAA thigh (change in thigh inclination)
2 IAA trunk (change in trunk inclination) – differentiate
lying – standing-up
3 IAA thigh - differentiate standing – sitting
4 IAA wrist – differentiate active arm movement – no
arm movement
Gait cycle features obtained:
- Step regularity
- Stride regularity
- Step symmetry
- Cadence
MSM - Classify motor symptom severity (i.e. rest/ kinetic
tremor, bradykinesia, and hypokinesia)
Tremor: feature extraction
- Frequency analysis
- Algorithm TS = i d
Bradykinesia: feature extraction
- average value of acceleration (during periods of
AAM)
- step length, step velocity
- duration standing-up
Hypokinesia
- % arm movement during the entire sitting and
standing time
- Arm swing and thigh swing correlation
Correlation with clinical
measure
__
Comparison multiple slide windows
(Mean CV, Mean error)
Cadence: 1.21%, 0.67%
Step regularity: 8.53%, 2.44%
Stride regularity: 9.34%, 4.47%
Step symmetry: 7.78%, 2.04%
Compared to
video recordings
(25 f/s) – testretest reliability
not assessed
AC - Activity detection
- PD – Overall accuracy of 98.9%
- Controls - Overall accuracy of
99.3%
MSM - Quantify tremors
- PD - accuracy of rest tremor;
sitting (84.5%) and standing
(94.1%) in the arm; sitting
(79.1%) and standing (90.1%) in
the thigh
- Kinetic tremor in the arm
detection; accuracy sitting
(78.7%) and standing (81.7%)
Quantification tremor
with UPDRS 20 scores
- Best correlation - rest
tremor in arm, r=.84
(p<.01)
- Kinetic tremor, r=.67
(p<.01) up to UPDRS
item 21
Severity in tremors (rest/kinetic),
which observed within one individual,
often different within the arm, thigh,
and trunk
Proposed method/monitor can
discriminate between different
settings of the DPS stimulator; Arm,
thigh, and trunk rest tremor (p<.05,
p=.01, and p<.01)
Abbreviations: H&Y, Hoehn & Yahr; AC, Activity Classifier; DBS, Deep Brain Stimulation; IAA, Integrals of the Absolute value of the Accelerometer output; MSM, Motor Symptom Monitor; AAM, Active Arm
Movement; TS, tremor severity; MAS, Most Affected Side; CV, coefficient of variance
Studies evaluating ABT-outcome measures to assess mobility-related functional activities in neurological populations
Reference
(Year)
Population/study design
Dobkin et
al33 (2011)
-
Mizuike
et al37
(2009)
-
-
Prajapati
et al40
(2011)
-
Zampieri
et al44
(2011)
Validation procedure
Clinical outcome measure(s)
Gait parameters
Pilot study
Stroke (N=12)
Healthy controls (N=6)
Stopwatch calculations
50-ft clinic walks at slow,
casual, and fast speeds
300-ft clinic-outdoor walks
Gait speed
Bouts of walking
Cadence
Swing time
Pearson correlation between stopwatch measured indoor
walking speed and algorithm-calculated speed, r=.98,
p=.001 and for repeated measures (p=.01)
Cross-sectional study
Stroke (N=63);
Brunnstrom stage
III(10), IV(22), V(15),
VI(16)
Control group (N=21);
elderly
Recorded observations
10m walk test
Accelerometers
derivatives (x, y, z axis):
Raw RMS
Normalized RMS
Autocorrelation function
Raw RMS and AC values significantly lower and normalized
RMS values were significantly higher at all axes in stroke
patients compared to controls.
Experimental study
Subacute Stroke
(N=16); BBS 41.8 ± 9.9
No control group
Footswitch system –
comparing FO and FC
events
Walking bouts
Total walking time
Gait speed
Number of steps
Gait symmetry
Swing symmetry
Cadence
Significant association between the number of walking
bouts to the total walking time (r=.76; p< .006) and
laboratory gait speed (r=.51; p<.45)
Laboratory gait speed and BBS (r=.60; p<.013)
Reported in Simoes et
al.49 – compared to a
Vicon system
iTUG test – 7m walkway
(three trails conducted at
home and laboratory setting)
Stride length
Stride velocity
Cadence
Peak arm swing velocity
Turning velocity
Correlation
with clinical
measure
__
Brunnstrom
Stages
These parameters were also significantly different between
control groups and each group in the different Brunnstrom
motor recovery stages.
Lower
laboratory gait
speed and
lower BBS
score
Significant gait symmetry increase between day-long
measurement compared with standard laboratory
assessment (p=.006), 12 out of 16 were more asymmetrical
during the day-long measurement
- Distances walked at home were slower and with shorter
__
steps in the PD group than the laboratory, but similar
between groups: PD = 5.9 ± 0.5m, Control = 5.9 ± 0.6m
in laboratory
- Significant group effect for stride velocity (p= 0.03),
cadence (p=.001), peak arm swing velocity MAS
(p=.002), and turning velocity (p=.02)
- Significant interaction effect for stride velocity (p=.02),
and stride length (p=.002)
- Significant location effect for turning velocity (p=.002) in
control group
Abbreviations: UPDRS, Unified Parkinson Disease Rating Scale; H&Y, Hoehn & Yahr Score; iTUG, instrumented Timed Up and Go Test; MAS, most affected side; 5WMT, 5-min Walking Test; BBS, Berg and Balance Scale
;FO, Foot off; FC, Foot Contact
-
Pilot study
Parkinson’s disease
(N=6); early-to-mid
stages, UPDRS 28.6 ±
15 and H&Y 1.9 ± 0.7
Healthy controls (N=8)
Compared laboratory gait
assessment with GAITRite
system
Results


