File
advertisement
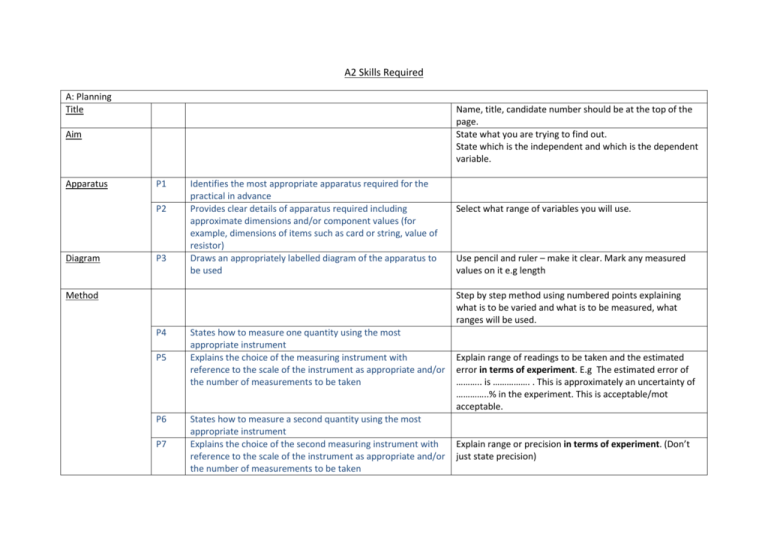
A2 Skills Required A: Planning Title Name, title, candidate number should be at the top of the page. State what you are trying to find out. State which is the independent and which is the dependent variable. Aim Apparatus P1 P2 Diagram P3 Identifies the most appropriate apparatus required for the practical in advance Provides clear details of apparatus required including approximate dimensions and/or component values (for example, dimensions of items such as card or string, value of resistor) Draws an appropriately labelled diagram of the apparatus to be used Method Select what range of variables you will use. Use pencil and ruler – make it clear. Mark any measured values on it e.g length Step by step method using numbered points explaining what is to be varied and what is to be measured, what ranges will be used. P4 P5 P6 P7 States how to measure one quantity using the most appropriate instrument Explains the choice of the measuring instrument with reference to the scale of the instrument as appropriate and/or the number of measurements to be taken States how to measure a second quantity using the most appropriate instrument Explains the choice of the second measuring instrument with reference to the scale of the instrument as appropriate and/or the number of measurements to be taken Explain range of readings to be taken and the estimated error in terms of experiment. E.g The estimated error of ……….. is ……………. . This is approximately an uncertainty of …………..% in the experiment. This is acceptable/mot acceptable. Explain range or precision in terms of experiment. (Don’t just state precision) Correct Measuring Techniques P8 Demonstrates knowledge of correct measuring techniques Fair Test P9 Repeats P10 Identifies and states how to control all other relevant quantities to make it a fair test Comments on whether repeat readings are appropriate for this experiment Safety Data P11 P12 Comments on all relevant safety aspects of the experiment Discusses how the data collected will be used Uncertainty/Error P13 Identifies the main sources of uncertainty and/or systematic error P14 Plan contains few grammatical or spelling errors P15 Plan is structured using appropriate subheadings P16 Plan is clear on first reading B:Implementation and Measurements Table of Results M1 Records all measurements with appropriate precision, using a table where appropriate M2 Readings show appreciation of uncertainty Examples: • zero error checks • repeat measurements (at different places if appropriate) • eye level to avoid parallax error • use of marker at centre of oscillations to aid timing • use of set square for checking vertical or horizontal arrangements • reading off scales between two graduation points • trig methods for measuring angles. ALL relevant quantities. Don’t just say you will repeat. Say why - relate to reliability and accuracy. E.g ‘I will be repeating the experiment BECAUSE there is a large margin for error from external sources/it is difficult to control all of the variables/there is room for error in the experiment and I will take a mean of the values to improve reliability.’ ALL What are you going to have on each axis of the graph, how will you derive the formula you need? – how will you calculate the constant? List the precision of different measurements with a short explanation. Explain any possible systematic errors in method or areas of uncertainty (May link with P8) All measurements in a column should have the same number of sig fig (usually 3 sig fig) as decided by the Instrument precision At the top of the column you should show the Instrument C: Analysis Graph Mathematical Analysis M3 M4 Uses correct units throughout Refers to initial plan while working and modifies if appropriate M5 Obtains an appropriate number of measurements precision (e.g.± 3mm) Units should be at the top of every column Make notes underneath table of ANY modifications that you have done. Justify why you haven’t made any. Minimum should be six different readings M6 Obtains measurements over an appropriate range One variable should double in the range used A1 A2 Produces a graph with appropriate axes (including units) Produces a graph using appropriate scales Logarithmic quantities are dimensionless e.g ln (x/m) Scale must be over half of the graph paper. BUT must also be easy to read. A3 A4 Plots points accurately Draws line of best fit (either a straight line or a smooth curve) A5 Derives relation between two variables or determines constant Processes and displays data appropriately to obtain a straight line where possible, for example, using a log/log graph Determines gradient using large triangle Uses gradient with correct units Uses appropriate number of significant figures throughout Uses relevant physics principles correctly Uses the terms precision and either accuracy or sensitivity appropriately Discusses more than one source of error qualitatively A6 Physics Explanation Errors A7 A8 A9 A10 A11 A12 Do NOT force it through the origin or the first point. Get the same number of points each side of the line (ignore anomalies) Use the gradient to calculate a constant Follows from P12 Use a triangle over half the size of the date spread Correct units for gradient. No unit for a log-log graph Usually 3 sigfig Physics principles; EXPLAIN why it happened. Review of P13. Precision Did the precision or estimated error (instrument precision + measurement error) you quoted in P13 work out in the experiment for each measurement. Accuracy Did your final answer work out to be close to the true value? A13 Calculates errors quantitatively Modifications A14 A15 Conclusion A16 Compounds errors correctly Discusses realistic modifications to reduce error/improve experiment States a valid conclusion clearly A17 A18 Discusses final conclusion in relation to original aim of experiment Suggests relevant further work Sensitivity How was the sensitivity of the apparatus you used? Calculate % error for each measurement individually. Estimated error/ Measurement taken x 100% Combine the individual % errors to make a total % error. If you use data logging as an improvement then explain how. State the final mathematical equation. Look back at your aim and answer it. Compare your answer with the theory…use the error and the LOBF to help you. Relevant and realistic ideas that can be done in the lab.
