JEC_1866_sm_TableS1-S4
advertisement
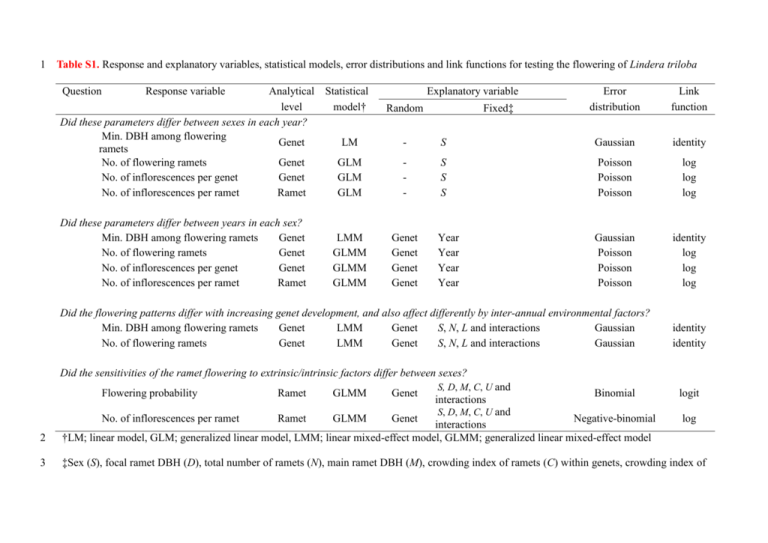
1 Table S1. Response and explanatory variables, statistical models, error distributions and link functions for testing the flowering of Lindera triloba Question Response variable Analytical Statistical level model† Did these parameters differ between sexes in each year? Min. DBH among flowering Genet LM ramets No. of flowering ramets Genet GLM No. of inflorescences per genet Genet GLM No. of inflorescences per ramet Ramet GLM Did these parameters differ between years in each sex? Min. DBH among flowering ramets Genet No. of flowering ramets Genet No. of inflorescences per genet Genet No. of inflorescences per ramet Ramet LMM GLMM GLMM GLMM Explanatory variable Random Fixed‡ Error distribution Link function - S Gaussian identity - S S S Poisson Poisson Poisson log log log Year Year Year Year Gaussian Poisson Poisson Poisson identity log log log Genet Genet Genet Genet Did the flowering patterns differ with increasing genet development, and also affect differently by inter-annual environmental factors? Min. DBH among flowering ramets Genet LMM Genet S, N, L and interactions Gaussian No. of flowering ramets Genet LMM Genet S, N, L and interactions Gaussian identity identity Did the sensitivities of the ramet flowering to extrinsic/intrinsic factors differ between sexes? Flowering probability Ramet GLMM Genet No. of inflorescences per ramet Ramet GLMM Genet S, D, M, C, U and interactions S, D, M, C, U and Binomial logit 2 Negative-binomial interactions †LM; linear model, GLM; generalized linear model, LMM; linear mixed-effect model, GLMM; generalized linear mixed-effect model log 3 ‡Sex (S), focal ramet DBH (D), total number of ramets (N), main ramet DBH (M), crowding index of ramets (C) within genets, crowding index of 4 understorey neighbouring trees (U), hours of sunshine during July-August in the previous year (L); interactions were considered up to second- 5 order. 6 Table S2. Summary of the explanatory variables used in the generalised linear mixed-effect models explaining the flowering probability and the 7 number of inflorescences produced on individual ramets within Lindera triloba genets All Mean Female SD Mean Male SD Mean No. of samples analysed† Genet 239 78 161 Ramet 2015 594 1421 Explanatory variable DBH of the focal ramet (D) DBH of the main ramet within genets (M) Crowding index of ramets within genets (C) Crowding index of understorey neighbouring trees (U) 1.71 4.32 5.59 1.83 1.89 6.86 199.99 122.99 1.59 4.27 5.07 1.71 1.96 6.00 205.20 143.01 1.76 4.38 5.89 SD t-value P-value‡ 1.87 1.84 7.05 1.91 0.41 1.03 0.07 0.68 0.31 195.84 113.19 0.54 0.59 8 9 † Only genets within a distance at least equal to the defined radius (12 m) from the plot edges were analysed, since genets close to the plot edges 10 had uncensused neighbouring trees outside the plot. 11 ‡ Differences in the overall averages between sexes were evaluated by t-tests. 12 13 Table S3. Sets of candidate models (generalised linear mixed-effect models) explaining the flowering probability and the number of inflorescences 14 produced on individual ramets within Lindera triloba genets. Response variable Rank Flowering 1 probability 2 3 4 5 6 7 8 9 10 11 12 13 14 15 AIC ΔAIC k 2647.81 0.000 14 2648.17 0.357 13 2648.23 0.422 15 2648.26 0.446 15 2648.40 0.590 14 2648.54 0.729 16 2649.12 1.302 15 2649.39 1.573 13 2649.48 1.664 16 2649.49 1.678 14 2649.53 1.717 15 2649.54 1.726 16 2649.64 1.824 15 2649.74 1.931 16 2649.76 1.944 17 Explanatory variable† S + D + M + C + U + L + D:C + S:D + S:M + S:C + S:U + S:L S + D + M + C + U + L + D:C + S:D + S:M + S:U + S:L S + D + M + C + U + L + D:C + S:D + S:M + S:C + S:U + S:L + S:D:C S + D + M + C + U + L + D:M + D:C + S:D + S:M + S:C + S:U + S:L S + D + M + C + U + L + D:M + D:C + S:D + S:M + S:U + S:L S + D + M + C + U + L + D:M + D:C + S:D + S:M + S:C + S:U + S:L + S:D:C S + D + M + C + U + L + D:C + D:L + S:D + S:M + S:C + S:U + S:L S + D + M + C + U + L + D:C + S:D + S:M + S:C + S:L S + D + M + C + U + L + D:M + D:C + D:L + S:D + S:M + S:C + S:U + S:L S + D + M + C + U + L + D:C + D:L + S:D + S:M + S:C + S:L S + D + M + C + U + L + D:C + D:U + S:D + S:M + S:C + S:U + S:L S + D + M + C + U + L + D:C + D:L + S:D + S:M + S:C + S:U + S:L + S:D:C S + D + M + C + U + L + D:M + D:C + D:L + S:D + S:M + S:U + S:L S + D + M + C + U + L + D:C + D:L + S:D + S:M + S:C + S:U + S:L + S:D:L S + D + M + C + U + L + D:M + D:C + D:L + S:D + S:M + S:C + S:U + S:L + S:D:L 15 Number of 1 16003.25 0.000 16 S + D + M + C + U + L + D:C + D:L + S:D + S:C + S:U + S:L + S:D:C + S:D:L inflorescences 2 16004.14 0.883 15 S + D + M + C + U + L + D:C + D:L + S:D + S:C + S:L + S:D:C + S:D:L The models are ranked by AIC (Akaike's Information Criteria); only models with ΔAIC (the difference in AIC score between the model considered 16 and the best one) ≤ 2 are denoted. The k indicates the numbers of parameters (including both fixed- and random-effect intercepts). 17 †As fixed-effect explanatory variables, sex (S), focal ramet DBH (D), main ramet DBH (M), crowding index of ramets within genets (C), crowding 18 index of understorey neighbouring trees (U), hours of sunshine during July-August in the previous year (L) and their interactions are considered. Table. S4. Summary of the best models (generalized linear mixed-effect models) explaining the flowering probability and the number of inflorescences produced on individual ramets within Lindera triloba genets. Explanatory variables† Flowering probability χ2 12.42 731.62 2.14 2.37 11.21 12.89 37.07 P-value < 0.01 < 0.01 0.03 0.15 < 0.01 < 0.01 < 0.01 No. of inflorescences χ2 147.86 208.04 1596.82 14.74 9.09 2547.70 22.34 88.18 3.84 P-value < 0.01 < 0.01 < 0.01 < 0.01 < 0.01 < 0.01 < 0.01 < 0.01 0.05 S D M C U L D:C D:L S:D 19.91 < 0.01 S:M 11.61 < 0.01 S:C 5.68 0.02 0.45 0.50 S:U 3.37 0.07 0.70 0.40 S:L 10.80 < 0.01 2259.58 < 0.01 S:D:C 19.25 < 0.01 S:D:L 20.43 < 0.01 To test the statistical significance of each variable, the changes in deviance when each variable was removed from the best models were compared to χ2 distributions (d.f. = 1). †As fixed-effect explanatory variables, sex (S), focal ramet DBH (D), main ramet DBH (M), crowding index of ramets within genets (C), crowding index of understorey neighbouring trees (U), hours of sunshine during July-August in the previous year (L) and their interactions (up to second-order) are considered.
