Populus Herbivory
advertisement
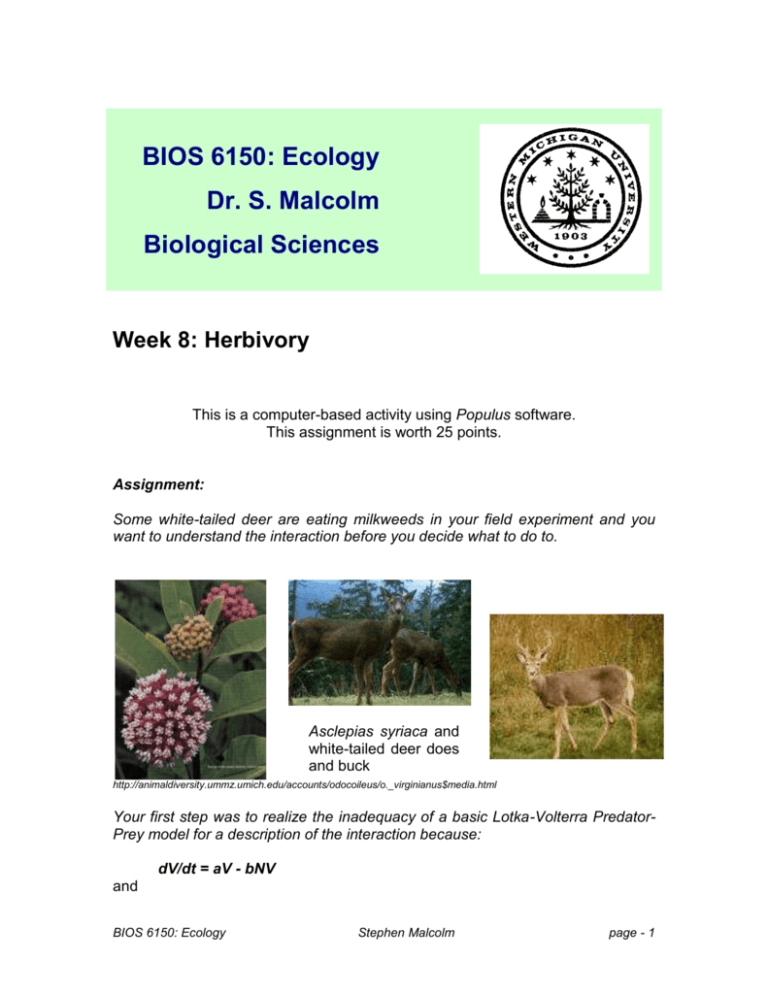
BIOS 6150: Ecology Dr. S. Malcolm Biological Sciences Week 8: Herbivory This is a computer-based activity using Populus software. This assignment is worth 25 points. Assignment: Some white-tailed deer are eating milkweeds in your field experiment and you want to understand the interaction before you decide what to do to. Asclepias syriaca and white-tailed deer does and buck http://animaldiversity.ummz.umich.edu/accounts/odocoileus/o._virginianus$media.html Your first step was to realize the inadequacy of a basic Lotka-Volterra PredatorPrey model for a description of the interaction because: dV/dt = aV - bNV and BIOS 6150: Ecology Stephen Malcolm page - 1 dN/dt = cNV - dN where: V = number of milkweed ramets, N = number of deer, a = the intrinsic rate of increase of milkweed ramets, b = the feeding rate of deer and milkweed defensive response to feeding, c = the numerical response of deer (efficiency with which deer turn food into progeny), and d = deer death rate. so milkweed ramets would increase without limit in the absence of deer. This is unreasonable and so you decide to add a logistic term, (K-V)/K, that limits your ramet population to a carrying capacity, K, through intraspecific (& intragenet) competition. This means that, dV/dt = (aV(K - V)/K) - bNV and dN/dt = cNV - dN Model these continuous, differential equations using the POPULUS Interaction Engine (under the "Model” menu) and set the plot to N vs N, and click the button “run until steady state” (you can also compare with the N vs t plot). Enter the equations to build the model after first deleting all the existing constants and then add your own according to the constants listed below with their starting values. Then uncheck N3 and rename N1 and N2 as V and N and put “2” in the box “Number of Equations.” Make sure the starting parameters are set to: V = 200 N = 20 (in the upper box) and in the lower box, a = 0.2, d = 0.3, K = 1000, c = 0.001, and b = 0.001. Run the model and add grids to the output. BIOS 6150: Ecology Stephen Malcolm page - 2 The N vs N plot should look like this: Now that you have a functioning resource-limited, plant-herbivore model examine how changes in a, b, and c influence the stability and final population sizes of milkweed ramets and deer after 100 time intervals. To do this please fill in the following table of milkweed and deer numbers after the model reaches a steady state (a little more than 100 intervals) and show the data in the following table (you can also print the graph output by clicking “print”) Parameter a = 0.2 a = 0.4 a = 1.2 Numbers of ramets V No's of deer N With a = 0.5 examine the following: b = 0.005 b = 0.001 b = 0.0008 With b = 0.001 examine the following: c = 0.0005 c = 0.001 c = 0.005 Using these graph printouts and the table answer these questions (please submit this table with your answers): 1) What effect does the intrinsic rate of milkweed ramet increase, a, have on the equilibrium population of milkweed ramets? BIOS 6150: Ecology Stephen Malcolm page - 3 2) What effect does increasing a have on deer abundance? 3) What effect does increasing a have on the rate of return to equilibrium? 4) What effect does b have on the equilibrium milkweed ramet population? 5) What effect does increasing b have on deer abundance? 6) What effect does increasing c have on the equilibrium milkweed ramet population? 7) What effect does increasing c have on the equilibrium deer population? 8) What effect does increasing c have on the stability of milkweed-deer dynamics? BIOS 6150: Ecology Stephen Malcolm page - 4 BIOS 6150: Ecology Computer Modelling Assignment - Bonus point activity For an additional 20 bonus points try and perform the following activity, once you have completed your computer modelling assignment, using the Populus interaction engine and answer the questions below: For 20 bonus points: Illustrate Rosenzweig's "paradox of enrichment" (Rosenzweig, 1971 Science 171: 385-387; Berryman, 1992, Ecology 73(5): 1530-1535) by setting a = 0.5, b = 0.001, c = 0.001, and d = 0.3, and increase K from 500, to 700, to 1000 to see the paradox. a) Complete a table of milkweed ramet and deer numbers for these different K values after 100 time intervals as you did above and also submit the 3 printed graphs. Parameter Numbers of ramets V Numbers of deer N K = 500 K = 700 K = 1000 b) What happens to the equilibrium ramet density with increasing K and why is it paradoxical? _____________________________________________________________ _____________________________________________________________ _____________________________________________________________ _____________________________________________________________ BIOS 6150: Ecology Stephen Malcolm page - 5
