Topic 16-Graphs and Data
advertisement
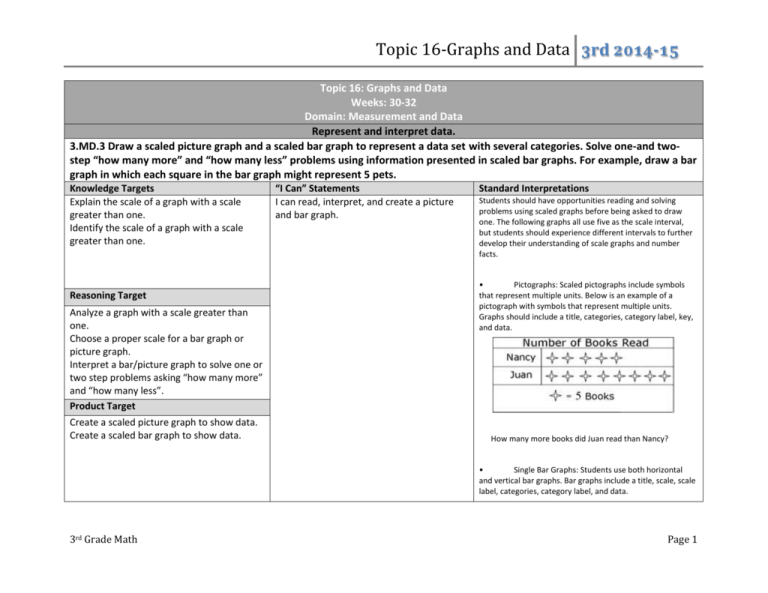
Topic 16-Graphs and Data 3rd 2014-15 Topic 16: Graphs and Data Weeks: 30-32 Domain: Measurement and Data Represent and interpret data. 3.MD.3 Draw a scaled picture graph and a scaled bar graph to represent a data set with several categories. Solve one-and twostep “how many more” and “how many less” problems using information presented in scaled bar graphs. For example, draw a bar graph in which each square in the bar graph might represent 5 pets. Knowledge Targets Explain the scale of a graph with a scale greater than one. Identify the scale of a graph with a scale greater than one. Reasoning Target Analyze a graph with a scale greater than one. Choose a proper scale for a bar graph or picture graph. Interpret a bar/picture graph to solve one or two step problems asking “how many more” and “how many less”. Product Target Create a scaled picture graph to show data. Create a scaled bar graph to show data. “I Can” Statements I can read, interpret, and create a picture and bar graph. Standard Interpretations Students should have opportunities reading and solving problems using scaled graphs before being asked to draw one. The following graphs all use five as the scale interval, but students should experience different intervals to further develop their understanding of scale graphs and number facts. • Pictographs: Scaled pictographs include symbols that represent multiple units. Below is an example of a pictograph with symbols that represent multiple units. Graphs should include a title, categories, category label, key, and data. How many more books did Juan read than Nancy? • Single Bar Graphs: Students use both horizontal and vertical bar graphs. Bar graphs include a title, scale, scale label, categories, category label, and data. 3rd Grade Math Page 1 Topic 16-Graphs and Data 3rd 2014-15 Make sense of problems and preserver in solving them. 3rd Grade Math Reason abstractly and quantitatively Construct viable arguments and critiques the reasoning of others Model with mathematics Use appropriate tools strategically Attend to precision Look for and make use of structure Look for and express regularity in repeated reasoning Page 2 Topic 16-Graphs and Data 3rd 2014-15 Represent and interpret data. 3.MD.4 Generate measurement data by measuring lengths using rulers marked with halves and fourths of an inch. Show the data by making a line plot, where the horizontal scale is marked off in appropriate units – whole numbers, halves, or quarters. Knowledge Targets Define horizontal axis. Identify each plot on the line as data or a number of objects. Reasoning Target Analyze data from a line plot. Determine appropriate unit of measurement. Determine appropriate scale for line plot. Performance Target Generate measurement data by measuring lengths using rulers marked with halves and fourths of an inch. “I Can” Statements I can create and analyze a line plot with appropriate scale using whole numbers, halves or quarters using measurement data. Standard Interpretations Students in second grade measured length in whole units using both metric and U.S. customary systems. It’s important to review with students how to read and use a standard ruler including details about halves and quarter marks on the ruler. Students should connect their understanding of fractions to measuring to onehalf and one-quarter inch. Third graders need many opportunities measuring the length of various objects in their environment. Some important ideas related to measuring with a ruler are: • The starting point of where one places a ruler to begin measuring • Measuring is approximate. Items that students measure will not always measure exactly ¼, ½ or one whole inch. Students will need to decide on an appropriate estimate length. • Making paper rulers and folding to find the half and quarter marks will help students develop a stronger understanding of measuring length Students generate data by measuring and create a line plot to display their findings. An example of a line plot is shown below: 3rd Grade Math Page 3 Topic 16-Graphs and Data 3rd 2014-15 Product Target Create a line plot where the horizontal scale is marked off in appropriate units- whole numbers, halves, or quarters. Make sense of problems and preserver in solving them. 3rd Grade Math Reason abstractly and quantitatively Construct viable arguments and critiques the reasoning of others Model with mathematics Use appropriate tools strategically Attend to precision Look for and make use of structure Look for and express regularity in repeated reasoning Page 4 Topic 16-Graphs and Data 3rd 2014-15 Topic 16: Graphs and Data Line Plot Pictograph Key Bar Graph Scale 3rd Grade Math Page 5

