3rd Grade Math ELG 3.MD.B: Represent and interpret data
advertisement

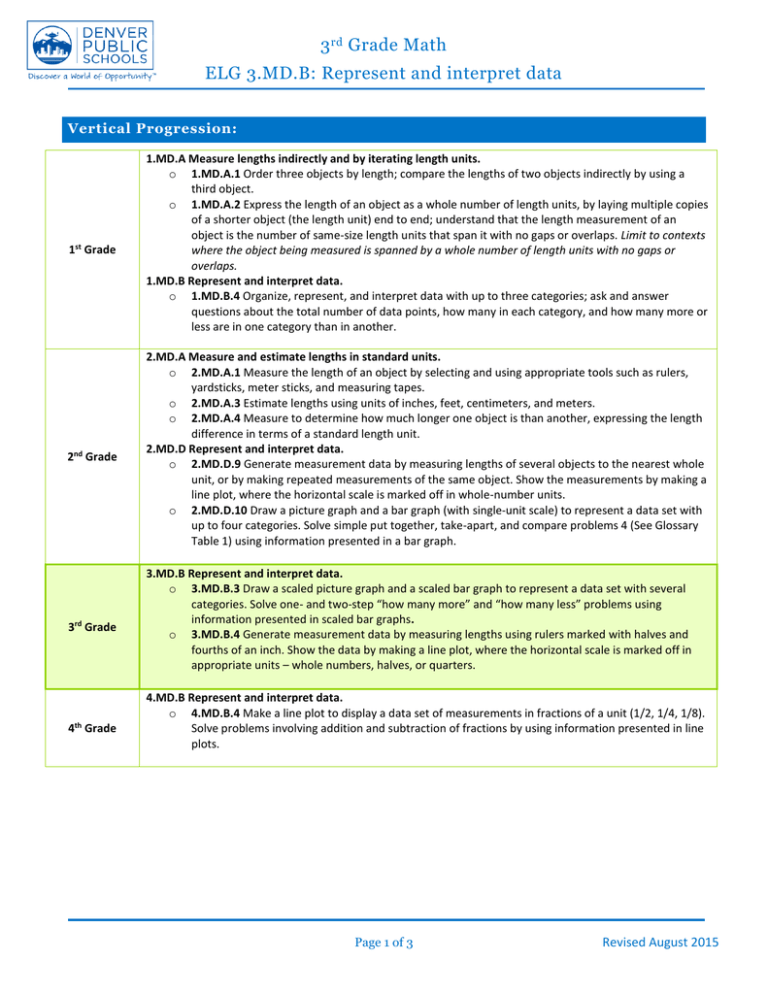
3 rd Grade Math ELG 3.MD.B: Represent and interpret data Vertical Progression: 1st Grade 2nd Grade 3rd Grade 4th Grade 1.MD.A Measure lengths indirectly and by iterating length units. o 1.MD.A.1 Order three objects by length; compare the lengths of two objects indirectly by using a third object. o 1.MD.A.2 Express the length of an object as a whole number of length units, by laying multiple copies of a shorter object (the length unit) end to end; understand that the length measurement of an object is the number of same-size length units that span it with no gaps or overlaps. Limit to contexts where the object being measured is spanned by a whole number of length units with no gaps or overlaps. 1.MD.B Represent and interpret data. o 1.MD.B.4 Organize, represent, and interpret data with up to three categories; ask and answer questions about the total number of data points, how many in each category, and how many more or less are in one category than in another. 2.MD.A Measure and estimate lengths in standard units. o 2.MD.A.1 Measure the length of an object by selecting and using appropriate tools such as rulers, yardsticks, meter sticks, and measuring tapes. o 2.MD.A.3 Estimate lengths using units of inches, feet, centimeters, and meters. o 2.MD.A.4 Measure to determine how much longer one object is than another, expressing the length difference in terms of a standard length unit. 2.MD.D Represent and interpret data. o 2.MD.D.9 Generate measurement data by measuring lengths of several objects to the nearest whole unit, or by making repeated measurements of the same object. Show the measurements by making a line plot, where the horizontal scale is marked off in whole-number units. o 2.MD.D.10 Draw a picture graph and a bar graph (with single-unit scale) to represent a data set with up to four categories. Solve simple put together, take-apart, and compare problems 4 (See Glossary Table 1) using information presented in a bar graph. 3.MD.B Represent and interpret data. o 3.MD.B.3 Draw a scaled picture graph and a scaled bar graph to represent a data set with several categories. Solve one- and two-step “how many more” and “how many less” problems using information presented in scaled bar graphs. o 3.MD.B.4 Generate measurement data by measuring lengths using rulers marked with halves and fourths of an inch. Show the data by making a line plot, where the horizontal scale is marked off in appropriate units – whole numbers, halves, or quarters. 4.MD.B Represent and interpret data. o 4.MD.B.4 Make a line plot to display a data set of measurements in fractions of a unit (1/2, 1/4, 1/8). Solve problems involving addition and subtraction of fractions by using information presented in line plots. Page 1 of 3 Revised August 2015 3 rd Grade Math ELG 3.MD.B: Represent and interpret data Students will demonstrate command of the ELG by: Drawing scaled picture graphs and bar graphs with several categories. Labeling bar and picture graphs with title and axis labels. Solving one and two step “how many more” and “how many less” problems using information presented in scaled bar graphs. Measuring lengths using rulers marked with halves and fourths of an inch. Showing measurement data by making a line plot. Vocabulary: data fourth(s) half/halves horizontal inch line plot quarter scale scaled bar graph scaled picture graph survey tally marks whole number(s) Sample Instructional/Assessment Tasks: 1) Standard: 3.MD.B.4 Source: http://www.k-5mathteachingresources.com/support-files/measuringstripslineplot.pdf Item Prompt: Measuring Strips Line Plot Materials: Set of strips (click on link), ruler Directions: 1. Measure each strip to the nearest ½ inch. Record the data in a table showing the strip letter and the measurement. 2. Use your data to create a line plot. Draw a horizontal line and record the scale. 3. Give your line plot a title and label the horizontal axis. 4. Plot your data by recording an X above the correct number for each strip measured. If a measurement is repeated place one X above the other. 5. Write three statements about the data in your line plot. Page 2 of 3 Revised August 2015 3 rd Grade Math ELG 3.MD.B: Represent and interpret data 2) Standard: 3.MD.B.3 Source: http://www.ode.state.or.us/wma/teachlearn/commoncore/mat.03.pt.4.toolk.a.411_v1.pdf Item Prompt: Tool Kits Prework: Students are to conduct a survey of the top 5 out of 7 items to include in a math tool kit and to include in a science tool kit. Students are to hand out the survey (below) to each classroom teacher at their campus by either delivering the survey to the classroom or by placing the survey in the teacher’s mailbox in the office. Teachers should be asked to return the survey within two days after receipt. Once all (or most) of the teacher surveys are returned, the class, with teacher assistance, will create a tally chart that shows the number of teachers that selected each of the 7 math tools and the number of teachers that selected each of the 7 science tools. An example of the tally chart for math tools is shown in Part A, and an example of the tally chart for science tools is shown in Part B. These charts must be completed prior to the start of Session 1. Materials: Teacher survey, Teacher Notes: Students will be unable to use the TE components of the task so all sessions and parts of the task must be printed. All sessions and parts should be solved by the teacher prior to instruction and require some advance preparation. The Tool Kits data may simply be teacher generated. Scale on bar graphs should be amended to include 2, 6, 10, 14, and 18. 3) Standard: 3.MD.B.3 Source: http://www.k-5mathteachingresources.com/support-files/jakes-survey.pdf Item Prompt: Jake’s Survey Page 3 of 3 Revised August 2015


