ece3738-sup-0001-TableS1-S2-FigS1
advertisement
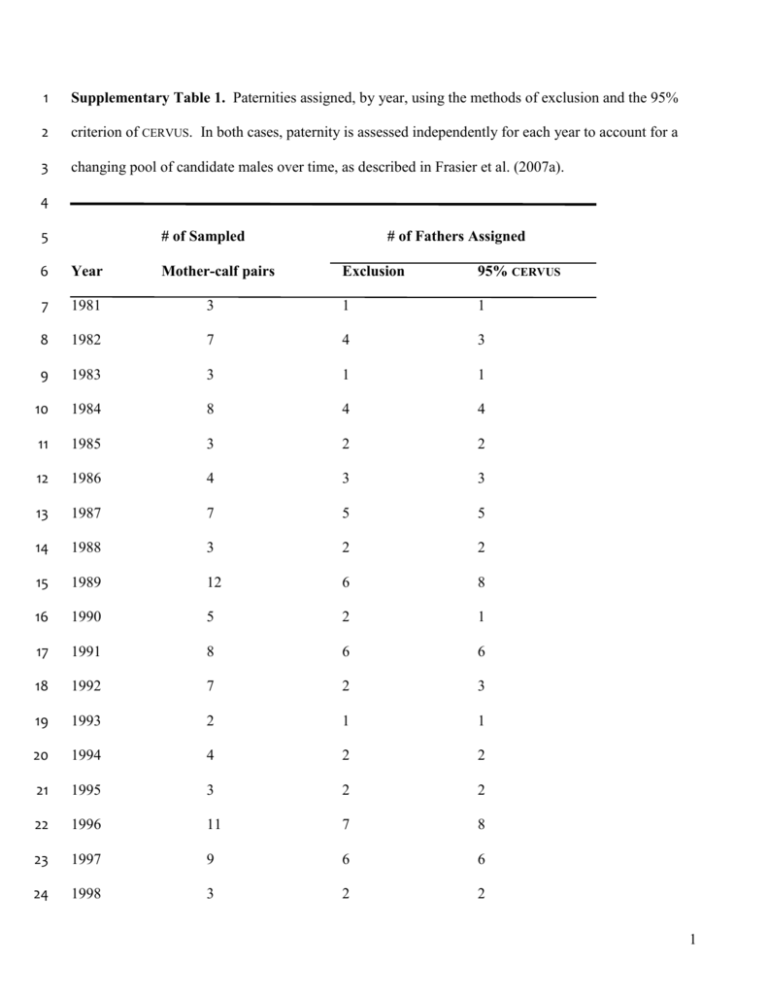
1 Supplementary Table 1. Paternities assigned, by year, using the methods of exclusion and the 95% 2 criterion of CERVUS. In both cases, paternity is assessed independently for each year to account for a 3 changing pool of candidate males over time, as described in Frasier et al. (2007a). 4 5 # of Sampled 6 Year 7 1981 8 Mother-calf pairs # of Fathers Assigned Exclusion 95% CERVUS 3 1 1 1982 7 4 3 9 1983 3 1 1 10 1984 8 4 4 11 1985 3 2 2 12 1986 4 3 3 13 1987 7 5 5 14 1988 3 2 2 15 1989 12 6 8 16 1990 5 2 1 17 1991 8 6 6 18 1992 7 2 3 19 1993 2 1 1 20 1994 4 2 2 21 1995 3 2 2 22 1996 11 7 8 23 1997 9 6 6 24 1998 3 2 2 1 25 1999 0 0 0 26 2000 0 0 0 27 2001 20 10 13 28 2002 8 4 3 29 2003 13 8 10 30 2004 13 11 9 31 2005 15 10 10 32 2006 7 4 7 33 Total 178 105 112 34 35 2 36 Supplementary Table 2. Observed mean values and 95% confidence intervals of expected values for 37 metrics associated with analyses of the MHC data. Metrics include internal relatedness of calves (IR), 38 heterozygosity-by-loci of calves (HL), mating pair relatedness (MPR), allele inheritance under the fetal 39 loss scenario (AIFL), and allele inheritance under the heterozygosity scenario (AIHET). 40 41 Metric Mean 95% CI 42 IR 0.126 0.114 – 0.129 43 HL 0.379 0.374 – 0.383 44 MPR -0.00840 -0.0166 – -0.000234 45 AIFL 0.869 0.857 – 0.881 46 AIHET 0.825 0.813 – 0.837 47 3 48 Supplementary Figure 1. Informative pedigrees for MHC data. This deviation from expected values 49 is expected if reproduction is biased towards more heterozygous offspring. However, note the small 50 number of MHC pedigrees that had this structure. 51 52 4
