Problems and Exercises – Use Cases
advertisement
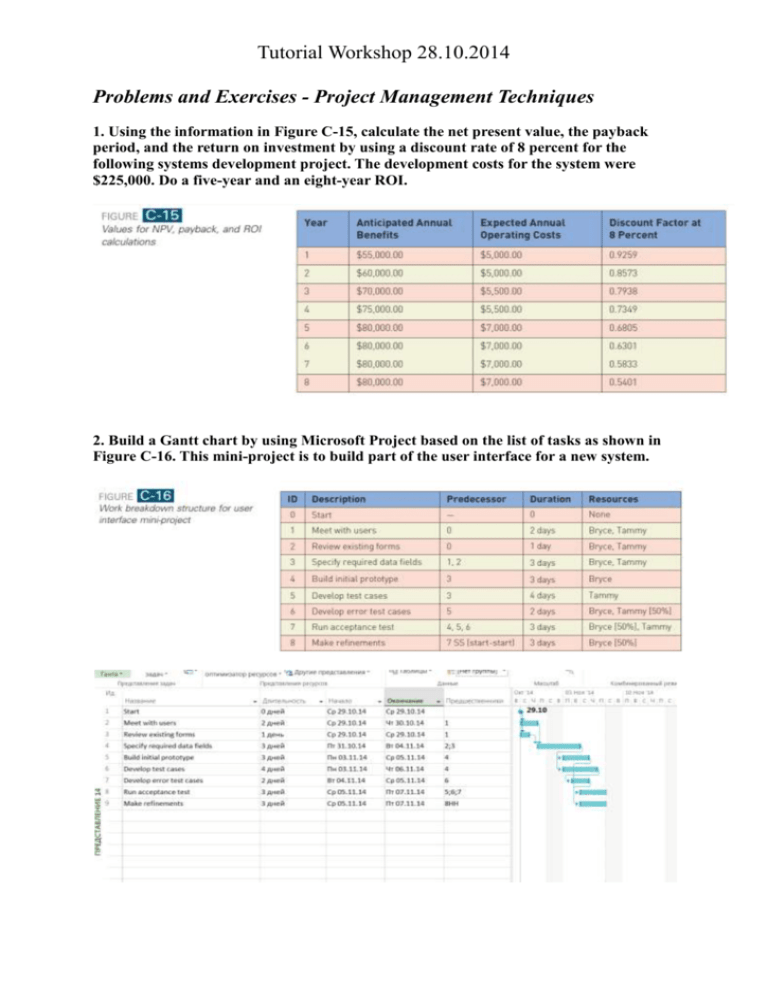
Tutorial Workshop 28.10.2014 Problems and Exercises - Project Management Techniques 1. Using the information in Figure C-15, calculate the net present value, the payback period, and the return on investment by using a discount rate of 8 percent for the following systems development project. The development costs for the system were $225,000. Do a five-year and an eight-year ROI. 2. Build a Gantt chart by using Microsoft Project based on the list of tasks as shown in Figure C-16. This mini-project is to build part of the user interface for a new system. Tutorial Workshop 28.10.2014 Problems and Exercises – Use Cases The following questions will make use of some tables in Figure 3-11 A, B, C, D & E below. Tutorial Workshop 28.10.2014 Tutorial Workshop 28.10.2014 1. Refer to the RMO CSMS Order Fulfillment subsystem shown in Figure 3-11. Draw a use case diagram that shows all actors and all use cases. Use a drawing tool such as Microsoft Visio if it is available. 2. Again for the Order Fulfillment subsystem, draw a use case diagram showing just the use cases for the shipping department in preparation for a meeting with them about the system requirements. Use a drawing tool such as Microsoft Visio if it is available. Tutorial Workshop 28.10.2014 3. Refer to the RMO CSMS Marketing subsystem shown in Figure 3-11. Draw a use case diagram that shows all actors and all use cases. Use a drawing tool such as Microsoft Visio if it is available. 4. Refer to the RMO CSMS Reporting subsystem shown in Figure 3-11. These reports were identified by asking users about temporal events, meaning points in time that require the system to produce information of value. In most actual systems today, an actor is assigned responsibility for producing the reports or other outputs when they are due. Recall that the actor is part of the system—the manual, nonautomated part. Thus, this is one way the “system” can be responsible for producing an output at a point in time. In the future, more outputs will be produced automatically. Draw a use case diagram that shows the use cases and actors, as shown in Figure 3-11. Use a drawing tool such as Microsoft Visio if it is available. Tutorial Workshop 28.10.2014

