Chapters 1-4 Test Review Packet
advertisement
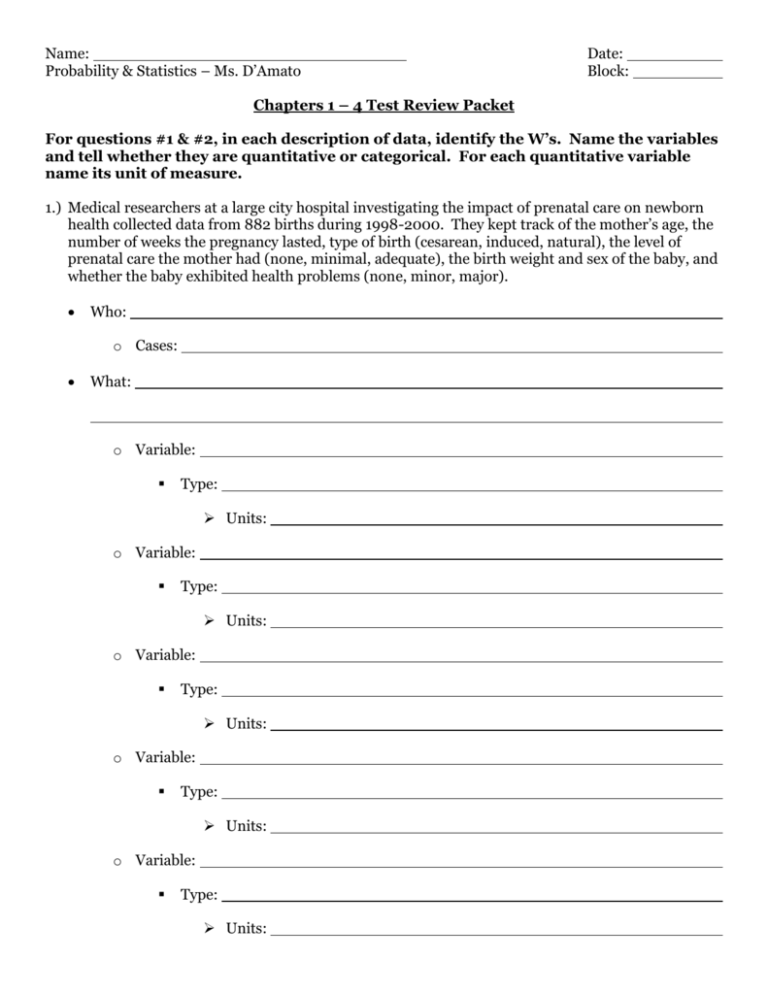
Name: Probability & Statistics – Ms. D’Amato Date: Block: Chapters 1 – 4 Test Review Packet For questions #1 & #2, in each description of data, identify the W’s. Name the variables and tell whether they are quantitative or categorical. For each quantitative variable name its unit of measure. 1.) Medical researchers at a large city hospital investigating the impact of prenatal care on newborn health collected data from 882 births during 1998-2000. They kept track of the mother’s age, the number of weeks the pregnancy lasted, type of birth (cesarean, induced, natural), the level of prenatal care the mother had (none, minimal, adequate), the birth weight and sex of the baby, and whether the baby exhibited health problems (none, minor, major). Who: o Cases: What: o Variable: Type: Units: o Variable: Type: Units: o Variable: Type: Units: o Variable: Type: Units: o Variable: Type: Units: o Variable: Type: Units: o Variable: Type: Units: Where: When: Why: How: 2.) A survey of autos parked in student and staff lots at a large university recorded the make, country of origin, type of vehicle (car, van, SUV, etc.) and age. Who: o Cases: What: o Variable: Type: Units: o Variable: Type: Units: o Variable: Type: Units: o Variable: Type: Units: Where: When: Why: How: Categorical vs. Quantitative For questions #3-8, classify the following variables as quantitative or categorical. 3.) Gender 4.) Age 5.) Time 6.) Length 7.) Model of a car 8.) Region of a country 9.) Define ordinal variables. 10.) Define identifier variables and provide examples. Bar Charts and Pie Charts: Company Coca-Cola Co. Pepsi-Cola Co. Dr. Pepper/7-Up Cott Corp. National Beverage Royal Crown Other Cases sold (millions) 4377.5 3119.5 1455.1 310.0 205.0 115.4 347.5 Market share (percent) 44.1 31.4 14.7 3.1 2.1 1.2 3.4 11.) Using the soft drink information above, make a bar chart of the cases sold. 12.) Now construct a pie chart of the market share using the soft drink information above. Contingency Tables: 13.) The table below is Census Bureau data on the years of school completed by Americans of different ages. Many people under 25 years of age have not completed their education, so they are left out of the table. Years of school completed, by age, 2000 (thousands of persons) Age group Education 25 to 34 35 to 54 55 + Total Did not complete high school 4,474 9,155 14,224 27,853 Completed high school 11,546 26,481 20,060 58,087 1 to 3 years of college 10,700 22,618 11,127 44,445 4 or more years of college 11,066 23,183 10,596 44,845 Total 37,786 81,435 56,008 175,230 Answer the following questions. Show all work and round to the nearest tenth. a.) What is the percent of people 25 years of age or older who have at least 4 years of college? b.) What is the marginal distribution of education level in percents? c.) What is the percent of people who are 25 to 34? d.) What percent of people aged 25 to 34 have completed 4 years of college? e.) What is the percent of people in the 55 and over age group who completed 4 or more years of college? f.) Find the conditional distribution of education level among 35 to 54-year-olds in percents. Histograms: 14.) Here are the weights (in pounds) of 20 steers on an experimental feed diet: 140 136 142 172 153 172 156 70 167 166 113 171 178 159 129 112 135 174 Create a histogram of the data. Please use 10 bins. Is the data unimodal, bimodal, or uniform? Is the histogram symmetric, skewed left, or skewed right? Are there any outliers? Stem-and-Leaf Display: 15.) Using the same information from #14, create a stem-and-leaf display of the data. 16.) The U.S. Food and Drug Administration limits the amount of caffeine in a 12-ounce can of carbonated beverage to 72 milligrams (mg). Data on the caffeine content of popular soft drinks are provided below. Create a split cell stem-and-leaf display of the data. Brand A&W Cream Soda Barq’s Root Beer Cherry Coca-Cola Cherry RC Cola Coca-Cola Classic Diet A&W Cream Soda Diet Cherry Coca-Cola Diet Coke Diet Dr. Pepper Diet Mello Yellow Diet Mountain Dew Diet Mr. Pibb Diet Pepsi-Cola Diet Ruby Red Squirt Diet Sun Drop Diet Sunkist Orange Soda Diet Wild Cherry Pepsi Dr. Nehi Dr. Pepper Caffeine (mg per 8-oz. serving) 20 15 23 29 23 15 23 31 28 35 37 27 24 26 47 28 24 28 28 Brand IBC Cherry Cola Kick KMX Mello Yello Mountain Dew Mr. Pibb Nehi Wild Red Soda Pepsi One Pepsi-Cola RC Edge Red Flash Royal Crown Cola Ruby Red Squirt Sun Drop Cherry Sun Drop Regular Sunkist Orange Soda Surge TAB Wild Cherry Pepsi Caffeine (mg per 8oz. Serving) 16 38 36 35 37 27 33 37 25 47 27 29 26 43 43 28 35 31 25

