Fig.12 Velocity contour at entrance of pump chamber.
advertisement
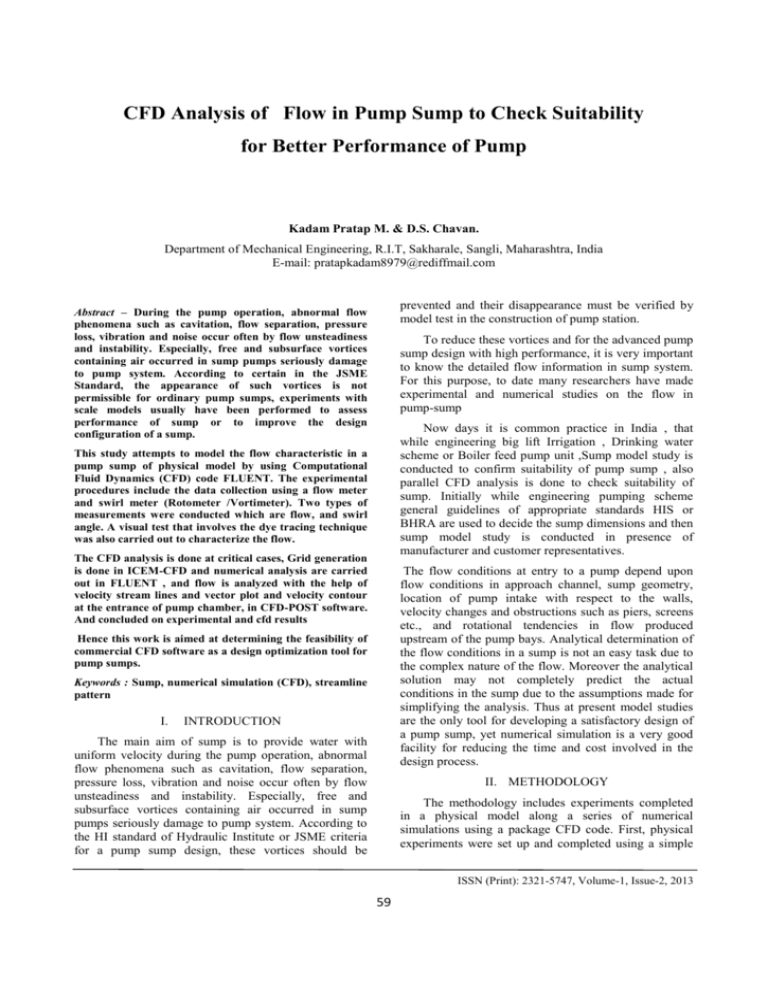
CFD Analysis of Flow in Pump Sump to Check Suitability for Better Performance of Pump Kadam Pratap M. & D.S. Chavan. Department of Mechanical Engineering, R.I.T, Sakharale, Sangli, Maharashtra, India E-mail: pratapkadam8979@rediffmail.com prevented and their disappearance must be verified by model test in the construction of pump station. Abstract – During the pump operation, abnormal flow phenomena such as cavitation, flow separation, pressure loss, vibration and noise occur often by flow unsteadiness and instability. Especially, free and subsurface vortices containing air occurred in sump pumps seriously damage to pump system. According to certain in the JSME Standard, the appearance of such vortices is not permissible for ordinary pump sumps, experiments with scale models usually have been performed to assess performance of sump or to improve the design configuration of a sump. To reduce these vortices and for the advanced pump sump design with high performance, it is very important to know the detailed flow information in sump system. For this purpose, to date many researchers have made experimental and numerical studies on the flow in pump-sump Now days it is common practice in India , that while engineering big lift Irrigation , Drinking water scheme or Boiler feed pump unit ,Sump model study is conducted to confirm suitability of pump sump , also parallel CFD analysis is done to check suitability of sump. Initially while engineering pumping scheme general guidelines of appropriate standards HIS or BHRA are used to decide the sump dimensions and then sump model study is conducted in presence of manufacturer and customer representatives. This study attempts to model the flow characteristic in a pump sump of physical model by using Computational Fluid Dynamics (CFD) code FLUENT. The experimental procedures include the data collection using a flow meter and swirl meter (Rotometer /Vortimeter). Two types of measurements were conducted which are flow, and swirl angle. A visual test that involves the dye tracing technique was also carried out to characterize the flow. The CFD analysis is done at critical cases, Grid generation is done in ICEM-CFD and numerical analysis are carried out in FLUENT , and flow is analyzed with the help of velocity stream lines and vector plot and velocity contour at the entrance of pump chamber, in CFD-POST software. And concluded on experimental and cfd results The flow conditions at entry to a pump depend upon flow conditions in approach channel, sump geometry, location of pump intake with respect to the walls, velocity changes and obstructions such as piers, screens etc., and rotational tendencies in flow produced upstream of the pump bays. Analytical determination of the flow conditions in a sump is not an easy task due to the complex nature of the flow. Moreover the analytical solution may not completely predict the actual conditions in the sump due to the assumptions made for simplifying the analysis. Thus at present model studies are the only tool for developing a satisfactory design of a pump sump, yet numerical simulation is a very good facility for reducing the time and cost involved in the design process. Hence this work is aimed at determining the feasibility of commercial CFD software as a design optimization tool for pump sumps. Keywords : Sump, numerical simulation (CFD), streamline pattern I. INTRODUCTION The main aim of sump is to provide water with uniform velocity during the pump operation, abnormal flow phenomena such as cavitation, flow separation, pressure loss, vibration and noise occur often by flow unsteadiness and instability. Especially, free and subsurface vortices containing air occurred in sump pumps seriously damage to pump system. According to the HI standard of Hydraulic Institute or JSME criteria for a pump sump design, these vortices should be II. METHODOLOGY The methodology includes experiments completed in a physical model along a series of numerical simulations using a package CFD code. First, physical experiments were set up and completed using a simple ISSN (Print): 2321-5747, Volume-1, Issue-2, 2013 59 International Journal on Mechanical Engineering and Robotics (IJMER) pump intake model. A series of test were completed to ensure the apparatus could provide experimental conditions that represented flow approaching a typical pump intake. Experiments were completed using this simple pump intake model under various flow rates to define a set of flow conditions with varying degrees of vortex development. Next, the series of simulations was completed using a commercial CFD software package that is ANSYS 13FLUENT-V6, to characterize the flow in the vicinity of a pump intake. The numerical model configuration was developed to simulate the actual conditions in the physical experimental setup. The approach for the numerical modelling involved the initial use of the parameters used in the physical experimental model, and direct comparison between experimental results and model predictions. It also included subsequent sensitivity analyses to address the sensitivity of the model predictions to the inherent assumptions and associated parameters. Fig.1 Detail arrangement of pump-sump model Principle of similarity III. EXPERIMENTAL METHODS As an experimental criterion of vortex occurrence estimation, HI standard [8] is adopted. The adopted principle of similarity between model and prototype is as followings. The Shirapur Lift Irrigation scheme in Solapur District in Maharashtra is proposed to irrigate 10000 Hectares of Command area. The lift irrigation scheme comprises of two Pumping stages with associated rising mains. Same Froude-number velocity (observing freesurface flow): Froude No. (Fr) is kept the same for the model and prototype. The Froude-number is the ratio of gravitational and inertial forces. The condition of free surface is fundamentally governed by the Froude No. Overall performance of any lift irrigation scheme not only depends upon technical suitability of machinery but also on proper intake structure and design of a sump. A faulty design of pump sump or intake is one of the major causes for unsatisfactory performance of pumping plant. Adverse conditions of flow approaching the intake sections may lead to occurrence of noise, vibrations and cavitation in the pumps and also cause reduction in pump efficiency. Though some standards are available which furnish guidelines and recommendations for ideal design of pump sump and intake, in many cases these standards cannot be adopted fully due to site constraints or any other governing factors. In such cases, it is essential to assess the performance of such sump which may not conform to standard design conditions & intake in advance by conducting investigations on a geometrically similar model. Using Froude criterion for essentially free surface flow Fm = Fp Also, Vm / Vp = (Lm / Lp)1/2 If Lm / Lp = 1 / 10, then Vm / Vp = (1 / 10)1/2 Flow relation is given by, Qm / Qp = (1 / 10) 2.5 Hence, Vm = 0.3162 Vp Qm = 0.003162 Qp Hence for Shirapur Stage II., If Qp = 3276 cubic m/ hr. at duty point for prototype then Qm = 2.88 Lit/sec for model pump. IV. CFD STUDIES In order to check the suitability of proposed prototype sump at site, a geometrically similar model sump with scale ratio 1:10 was constructed in Mild steel sheets and angle frames and acrylic materials and run with scale model pumps to study the flow patterns in the sump. The sump is to be suitable for 4 no’s .of horizontal centrifugal pumps. Fig 1 shows the detail drawing of the model setup. From a purely numerical perspective the geometric complexity of the problem is such that it demands the full power of modern computational fluid dynamics (CFD) to solve the equations of motion and turbulence models in domains that involve multiple surfaces. Additional difficulties are associated with modeling free surface and vortex phenomenon, the physics of which is not yet fully understood. Inspite of the practical ISSN (Print): 2321-5747, Volume-1, Issue-2, 2013 60 International Journal on Mechanical Engineering and Robotics (IJMER) importance of the problem, the literature on numerical modeling of pump intake flows is rather limited. The computational investigations were performed using ANSYS ICEM CFD 13.0 and ANSYS FLUENTV6 software’s. ANSYS ICEM CFD 13.0 was used for mesh generation while the analysis was done using ANSYS FLUENT-V6. The inputs and outputs of both the software’s are in easily accessible formats enabling full integration with any CFD software. For the CFD model in the present study, volumetric meshing with unstructured tetra meshing option was adopted for grid generation in the pump sump geometry which is shown in figure 3 In general the mesh generated for different variants had about 8 to 12 lakh elements with the number of nodes varying from 1 to 2 lakhs. Review of the available literature reveals that site specific computational studies have been undertaken for certain projects [4]. The only generalized study has been conducted at IIHR [1],[2] and that too pertains to development of CFD code for simple rectangular sump having one and two pumps. The developed software cannot be used as general software for CFD analysis of any intake structure. In the present work an attempt has been made to simulate and predict the flow conditions such as vortices and swirl for multiple pump intakes in a single sump, with an aim to determine the viability of, commercially available computational fluid dynamic software – ANSYS FLUENT as an important design optimization tool for intake sumps. Geometry Of Computational Model Computational study was conducted for the same pumping system that is Shirapur Lift Irrigation scheme of having four pumps, and space for one pump is provided on one side for future scope. The layout includes a leading channel, approach channel, forebay, pump sump and intake. A model of the prototype at a scale of 1:10 was used for hydraulic analysis. The geometry of the simulation model starts with the inlet to the sump followed by a short approach section and a vertically sloping section which ends in an expanding forebay. After the forebay is the rectangular portion of the sump consisting of four identical pump bays. Towards the end of each of the bay is placed the suction pipe of a pump at required clearances from the boundaries. The length of the suction pipes is extended above the sump boundary to some distance. Fig.3 Tetrahedral grid of fluid domain. The domain was specified as a Non-Buoyant, Stationary Fluid domain with working fluid as water at 25°C and reference pressure as 1atm. The turbulence model was selected as K-Є model. As boundary conditions for the steady state calculation, zero pressureinlet condition at the inlet and averaged velocity of 0.7478 m/s at the outlet of pipe at 1F run condition and 1.4967 m/s at 2F run condition are applied considering the equal velocity flow condition. Water level is kept to Different levels that are at HFL and MDDL. As the wall conditions, free-slip condition is applied to the upper side of pump sump model passage. No-slip condition is applied to side and bottom walls and at pipe outside and inside. The ANSYS FLUENT-V6 Solver module of ANSYS-13 was used to obtain the solution of the CFD problem. The solver control parameters were specified in the form of solution scheme and convergence criteria. Table 1 shows the fluent solution setting. Fig.2 3-d model of sump Figure 2 SHOWS 3-D model of sump which is created in Pro-e wildfire-4. This model is transferred into ICEM-CFD using .stp or .igs format. ISSN (Print): 2321-5747, Volume-1, Issue-2, 2013 61 International Journal on Mechanical Engineering and Robotics (IJMER) TABLE 1 Details of FLUENT Solution settings The results of the computational simulation can be analyzed using number of variables. In this study it has been restricted to the comparison of results based on the pattern of streamlines of flow and the velocity profiles. Sr. No. Settings Choice 1 Simulation 3D 2 Solver Pressure Based 3 Model Viscous standard ke, standard wall Fn 4 Material Water 5 Pressure Velocity Coupling scheme Simple 6 Gradient Green-Gauss Node Based 7 Discretization Pressure STANDARD 8 Discretization Momentum First Order upwind Pressure – Density - 1 , 10 Under-Relaxation factors V. ANALYSIS OF SIMULATION RESULTS The streamline pattern (Figure 4) shows that a very large rotating mass of fluid is created in the forebay portion but it not affects the smooth entry of water in each pump due to the length of the forebay is more. Also there flow is maximum on the side where space for future expansion is kept blank, similarly in experimental we get the maximum flow on blank pump chamber side which is analyzed by using wool thread which is shown in figure 5. And there is no any surface or submerged vortices in the pump chamber. 0.3, Body Forces - 1, Momentum and - 0.4 Turbulent kinetic Energy – 0.8 Fig. 4 Velocity stream lines starting from the inlet 11 Compute from Inlet Upwind scheme was specified for the solution while for convergence the residual target for RMS values was specified as 10-6. With the above specified convergence criteria it took about 30hrs for the solution of one simulation variant. The results of the CFD analysis were analyzed using CFD-post, the post processor module of ANSYS 13. Initially, numerical simulation of flow through the sump model (scale 1:10) was performed and the results was analyzed. Results of numerical simulation of flow in the original model showed flow disturbances only in the forebay but length of forebay is more so it can’t affect the performance of sump. In experiment vortex was observed when water level reduces 150mm below Minimum water level (MDDL) so this case was also analyzed in the CFD and we get the location of vortex by using CFD. Fig.5 Photographic view showing flow pattern Fig 6 shows the velocity vector plot at XY plane at middle position which shows when water enters in forebay there is hydraulic jump occurs in the forebay ISSN (Print): 2321-5747, Volume-1, Issue-2, 2013 62 International Journal on Mechanical Engineering and Robotics (IJMER) due to back flow of water. Similarly in experimental study hydraulic jump occurs at near about same position in approach channel. But it does not affect smooth flow at suction because the length of fore bay is more and due to this swirl vanishes up to pump chamber. Fig. 7 shows photographic view of hydraulic jump at entrance of the forebay in experimental study. Fig.8 shows velocity stream lines near and inside the suction pipe which shows there is smooth entry in belmouth without any swirl. Similarly Fig.9 show smooth stream line entry of water in bell mouth and pipe using wool thread. Fig. 6Velocity vector showing hydraulic jump in Forebay Fig.9 Stream line flow at belmouth without swirl Fig 10 shows velocity vector at top surface which shows direction of water particles. Fig. 7Photographic view showing hydraulic jump Fig.10 Velocity vector plot A comparison of the velocity vector plots inside the pump column (Figure 11) also show that the velocities have increased at the inlet as well as in the belmouth section in the final variant of the model, however the swirl has reduced. Fig.8 Stream line flow at belmouth without swirl ISSN (Print): 2321-5747, Volume-1, Issue-2, 2013 63 International Journal on Mechanical Engineering and Robotics (IJMER) Fig.13 Concentrated pressure drop at top surface at water level below M.D.D.L Fig.11 Velocity vector near belmouth. Fig.12 shows velocity contour at entrance of pump chamber where maximum velocity of water at entrance of pump chamber is 1.64e-2m/s which is within limit as per standard which is 0.5 m/s. Fig.14 Top view showing surface vertices at water level 150mm below MDDL Fig.12 Velocity contour at entrance of pump chamber. Fig 13 shows pressure distribution at top surface when water level reduces 150 mm below MDDL, a reduced pressure is concentrated near pipe 4 region which means water particles concentrated at that point where pressure is less or vortex is created at low pressure region due to water particles flows towards less pressure area with increased velocity. This can be also seen with the help of velocity stream lines which are shown in Fig.14 and Fig.15 which shows helical path of streamlines that is vortex formation. Similarly in experimental study when water level reduces below MDDL, vortex occurs near the pipe 4 which is observed by die injection. This is shown by Fig.16 Fig.15 Velocity streamlines showing surface vortex at water level 150 mm below MDDL ISSN (Print): 2321-5747, Volume-1, Issue-2, 2013 64 International Journal on Mechanical Engineering and Robotics (IJMER) [3] Kshirsagar J .T. and Joshi S.G. 2003, “Investigation of air entrainment-A Numerical Approach,” Fluid Engineering Division’s Summer Meeting 2003-45415, Proceedings of the Forth ASME-JSME Joint Fluid Engineering Conference, Honolulu, Hawaii. [4] Joshi, S.G. and Shukla, S.N. (2000), “Experimental and Computational Investigation of Flow through a Sump”, Pumps & Systems Asia 2000. Nakato Tatasuaki., Weinberger Marc. and Logden Fred. (1994), “A Hydraulic model study of Korea Electric Power Corporation Ulchin Nuclear Units 3 and 4 circulating-water and essential-service-water Intake structure”, IIHR Technical Report No 370. [5] W.T. Kang, K.H. Y and B.R. Shin “An Investigation of Surface Vortices Behavior in Pump Sump” The 11th Asian International Conference on Fluid Machinery and the 3rd Fluid Power Technology Exhibition [6] Jong- Woong Choi, Young-Do Choi , Chang-Goo Kim and Young-Ho Lee “Flow uniformity in a multi-intake pump sump model” Journal of Mechanical Science and Technology 24 (7) (2010) 1389~1400 [7] Shin, C.S., E.M. Greitzer, W.K. Cheng, C.S. Tan, and C.L. Shippee, 1986, “Circulation measurements and vortical structure in an inletvortex field”, Journal of Fluid Mechanics, Vol 162, Pp 463-487. [8] Hydraulic Institute Standard, 1998, American National Standard for Pump Intakes Design, ANSI/HI 9.8. [9] JSME, 1984, Standard Method for Model Testing the Performance of a Pump Sump, JSME S 004. [10] ANSYS, 2013, Fluent theory guide, Version 13 Fig. 19 Photographic view showing position of vortex when water level reduces below MDDL VI. CONCLUSIONS A uniform pump approaching flow existed in the pump chambers. Even water level goes below MDDL up to 110mm there is no any surface or submerged vortices are occurred this was indicated from the results of pre-rotation tests. The commercial CFD package ANSYS FLUENT V6 was used to predict the three dimensional flow and vortices in a pump sump model. The CFD model predicts the flow pattern in detail and the location, and nature of the vortices. However, considerable post-processing of the basic data is needed to fully comprehend the details of the flow. Thus CFD model can be used to study the effect of various parameters which reduces time as well as cost and hence can become an important tool for optimization of pump sump geometry. VII. REFERENCES [1] [2] Constantinescu G.S., and Patel, V.C. (1998), “Numerical model for simulation of pump-intake flow and vortices”, ASCE Journal of Hydraulic Engineering, Vol.124, No.2, 123-124. Constantinescu1, G.S. and Patel, V.C. (2000), “Role of Turbulence Model In Prediction of Pump-Bay Vortices”, ASCE Journal Of Hydraulic Engineering, Vol.126, No.5, 387-390. ISSN (Print): 2321-5747, Volume-1, Issue-2, 2013 65
