Document - University of Colorado Boulder
advertisement

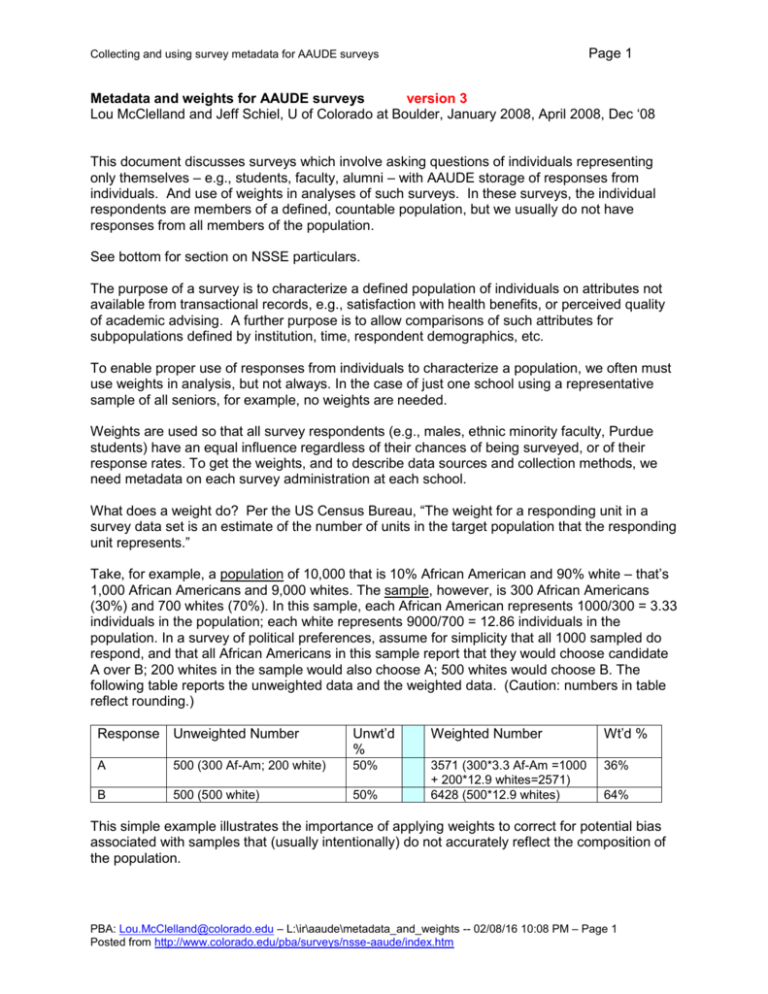
Page 1 Collecting and using survey metadata for AAUDE surveys Metadata and weights for AAUDE surveys version 3 Lou McClelland and Jeff Schiel, U of Colorado at Boulder, January 2008, April 2008, Dec ‘08 This document discusses surveys which involve asking questions of individuals representing only themselves – e.g., students, faculty, alumni – with AAUDE storage of responses from individuals. And use of weights in analyses of such surveys. In these surveys, the individual respondents are members of a defined, countable population, but we usually do not have responses from all members of the population. See bottom for section on NSSE particulars. The purpose of a survey is to characterize a defined population of individuals on attributes not available from transactional records, e.g., satisfaction with health benefits, or perceived quality of academic advising. A further purpose is to allow comparisons of such attributes for subpopulations defined by institution, time, respondent demographics, etc. To enable proper use of responses from individuals to characterize a population, we often must use weights in analysis, but not always. In the case of just one school using a representative sample of all seniors, for example, no weights are needed. Weights are used so that all survey respondents (e.g., males, ethnic minority faculty, Purdue students) have an equal influence regardless of their chances of being surveyed, or of their response rates. To get the weights, and to describe data sources and collection methods, we need metadata on each survey administration at each school. What does a weight do? Per the US Census Bureau, “The weight for a responding unit in a survey data set is an estimate of the number of units in the target population that the responding unit represents.” Take, for example, a population of 10,000 that is 10% African American and 90% white – that’s 1,000 African Americans and 9,000 whites. The sample, however, is 300 African Americans (30%) and 700 whites (70%). In this sample, each African American represents 1000/300 = 3.33 individuals in the population; each white represents 9000/700 = 12.86 individuals in the population. In a survey of political preferences, assume for simplicity that all 1000 sampled do respond, and that all African Americans in this sample report that they would choose candidate A over B; 200 whites in the sample would also choose A; 500 whites would choose B. The following table reports the unweighted data and the weighted data. (Caution: numbers in table reflect rounding.) Response Unweighted Number Unwt’d % Weighted Number Wt’d % A 500 (300 Af-Am; 200 white) 50% 36% B 500 (500 white) 50% 3571 (300*3.3 Af-Am =1000 + 200*12.9 whites=2571) 6428 (500*12.9 whites) 64% This simple example illustrates the importance of applying weights to correct for potential bias associated with samples that (usually intentionally) do not accurately reflect the composition of the population. PBA: Lou.McClelland@colorado.edu – L:\ir\aaude\metadata_and_weights -- 02/08/16 10:08 PM – Page 1 Posted from http://www.colorado.edu/pba/surveys/nsse-aaude/index.htm Collecting and using survey metadata for AAUDE surveys Page 2 Weights may be needed to correct for wildly different response rates as well. If the population is half men and half women, and all are sampled (it’s a census), and 90% of women respond, and 45% of the men, then 2/3 of the respondents will be women, so the respondents will not (necessarily) represent the entire population very well. In this case each female respondent represents 1.1 = 1/90% people, and each male respondent represents 2.2 = 1/45% people. This ignores the possibility that the 55% of males who did not respond differ systematically from the 45% who did. In analyses of AAUDE survey data, weights are needed to correct for potential bias due to Different selection probabilities – E.g., Brandeis surveys every senior, Wisconsin 1 in 5. Or Colorado surveys all seniors in Engineering, half of all others. Different response rates – E.g., 60% of UVa alumni surveyed respond, 40% of Kansas’. Or 60% of Colorado women surveyed respond, 30% of Colorado men. Different population sizes – Cal Tech might have 500 seniors, Ohio State 5000. Different (or non-) participation – Nebraska surveys seniors, Northwestern does not (an extreme form of “different selection probability,” where the probability for NW is zero) Note that the differences can be across schools, within schools, or both. Below we consider some analysis questions, with narrative notes on weighting that would be required to address each one. Eventually long, skinny warehouse survey data (where a row is a year x school x respondent x item combination) will get turned into files useable for analyses by users, where a row is a respondent. Those analysis-ready files will (eventually!) include the weights described here. Consider the following analyses – perhaps requested by the AAU – and the corrections needed for each. Assume we have responses from seniors at 15 schools. #1. How many AAU seniors each year say they’re going to graduate or professional school within the next year? Here the desired answer is a single number suitable for comparison to something like total national enrollment in graduate and professional schools, or national bachelor’s degrees granted. Correct for differential selection probabilities and response rates. Each Brandeis respondent might represent 1.5 seniors (sampled all, 2/3 responded); each Colorado respondent might represent 5 (sampled 40%, half responded); at Michigan State it’s different by school and college. Correct for differential participation – we have to add in some number to represent the 45+ schools from which we have no data, because the question is about “AAU seniors,” not “surveyed seniors.” To do this we have to have some idea how many seniors – population members -- there are at the 45+ non-participant schools, AND we have to state our assumptions carefully; e.g., that schools not participating look like those that did. Or we redefine to characterize “seniors at AAU schools which surveyed.” #2. What percentage of AAU seniors each year say they’re going to graduate or professional school? Here the desired answer is a single percentage. Correct for differential selection probabilities and response rates, as above. Cannot correct for non-participants. Instead, list the schools that did participate (or that did not) and say results may not be representative of seniors at all AAU schools. #3. Seniors at the average AAU school rated their satisfaction with . . . an average of “good” to “excellent” (3.5 on a 1-5 scale). Here we’re characterizing the average school, not the average senior. Here we want Wisconsin and Brandeis to contribute equally to the result, not contribute proportionally to their number of seniors. Correct for differential selection probabilities and response rates, as above. Cannot correct for non-participants; note participating schools as above. PBA: Lou.McClelland@colorado.edu – L:\ir\aaude\metadata_and_weights -- 02/08/16 10:08 PM – Page 2 Posted from http://www.colorado.edu/pba/surveys/nsse-aaude/index.htm Collecting and using survey metadata for AAUDE surveys Page 3 Correct for different population sizes over school to equate contributions by school. This is most easily done by averaging within school, then finding the median school or even averaging the averages. It can be done with weights, but it’s more complicated. #4. Among those with any debt, the variance in debt at graduation among seniors at AAU publics is greater than the variance among seniors at AAU privates. When the issue is variance (not means, not percentages, not counts) and/or statistical tests that depend on variance (which is virtually all of them except the “hits you between the eyes” test), the weighted N can inflate or otherwise distort variance. Moreover, different statistical programs may differ in how they compute weighted variance. For such analyses we need a weight which brings the weighted-N back to the N of actual respondents (not population), more or less. Such a weight could be used in characterizing the population of individuals (seniors at AAU schools) or the population of schools. So, from all the above, we need WtToPop: A weight which corrects for different selection probabilities and different response rates. The sum of these weights over all respondents is the total number in the specified population (e.g., seniors) at participating schools. For an individual case this weight is the number of people the respondent represents in the population from which the respondent was drawn. Calculation: (N in the population of the group; e.g., Colorado engineering) / (N of respondents from that group). [That’s population, not sample.] An estimate of the N in the population for each AAUDE school, including non-participating schools. WtToSchoolsEqual: A weight to get to equal contribution by each school, with proper weight to population subgroups within each school. Sum over respondents = N of participating schools x (some arbitrary number, such as 1.0, 100, 1000; here I’ve used 100). This can also be thought of as the weight needed to make each school the same size. Calculation: WtToPop x [(arbitrary N) / (N in population for the entire school)]. This weight is not needed if you get averages or other measures by school first, then average or summarize those. WtToNRespondents: A weight to bring the weighted-total-N back to around the total N of actual respondents, with proper weight to population within each school. The sum over respondents is more or less equal to the N of respondents. Calculate as WtToPop x (Total N of respondents across all participating schools ) / (Total population across all participating schools). Use of the weights, in the analyses presented above #1. How many AAU seniors each year say they’re going to graduate or professional school within the next year? Calc weighted percentage using WtToPop, then apply that percentage to the estimated total population in both participating and non-participant schools, clearly stating the assumption that seniors in non-participating schools are like those in participating schools. #2. What percentage of AAU seniors each year say they’re going to graduate or professional school? Calc weighted pct using WtToPop. #3. Seniors at the average AAU school rated their satisfaction with . . . an average of “good” to “excellent” (3.5 on a 1-5 scale). Easiest: Compute weighted mean for each school based on WtToPop (or raw if no subgroups with differential sampling or response rates), then find the median of those over schools. Also possible: Calc weighted mean (or median) using weight = WtToSchoolsEqual. #4. Among those with any debt, the variance in debt at graduation among seniors at AAU publics is greater than the variance among seniors at AAU privates. Filter to has-debt PBA: Lou.McClelland@colorado.edu – L:\ir\aaude\metadata_and_weights -- 02/08/16 10:08 PM – Page 3 Posted from http://www.colorado.edu/pba/surveys/nsse-aaude/index.htm Collecting and using survey metadata for AAUDE surveys Page 4 respondents; calc weighted variance using weight = WtToNRespondents, compare variances for publics and privates. Or, if want each school contributing equally, do as above within schools, then compare distribution of variances across schools for publics and privates. NSSE particulars With NSSE we get responses, period. To calculate the weights, and to calculate response rates, we need to know the N’s in the eligible populations (e.g., NSSE-eligible seniors at Arizona, 2007), and the N from that population in the NSSE random sample, and the N of respondents from the sample. We know the N of respondents already In 2008 NSSE provided us with institutional metadata: N’s for population and sample for school x freshmen vs. senior x year, for random sample only, for 2005 and later. We used the N’s to calculate three weights: WtToPop, WtToSchoolsEqual, and WtToNRespondents. These are available for 2005 and later only. They are in the metadata dataset, which can be merged easily with the response-level dataset. The weights described in this document are NOT the same as the NSSE-computed weights stored in the response-level dataset (e.g., WEIGHT1 and WEIGHT2). See the user guide for additional information on NSSE-computed weights. References Johnson, A. G. The Blackwell Dictionary of Sociology: A User's Guide to Sociological Language. 2nd ed. Cambridge, MA: Blackwell, 2000. US Census Bureau, Survey of Income and Program Participation (SIPP), “SIPP Weighting,” no date, no author. http://www.sipp.census.gov/sipp/weights.html Yansaneh, Ibrahim S. Construction and use of sample weights, 2003. United Nations Secretariat, Statistics Division. Draft for Handbook on designing of household sample surveys. http://unstats.un.org/UNSD/demographic/meetings/egm/Sampling_1203/docs/no_5.pdf PBA: Lou.McClelland@colorado.edu – L:\ir\aaude\metadata_and_weights -- 02/08/16 10:08 PM – Page 4 Posted from http://www.colorado.edu/pba/surveys/nsse-aaude/index.htm


