Text S3. Theoretical Point Spread Function of HSM
advertisement

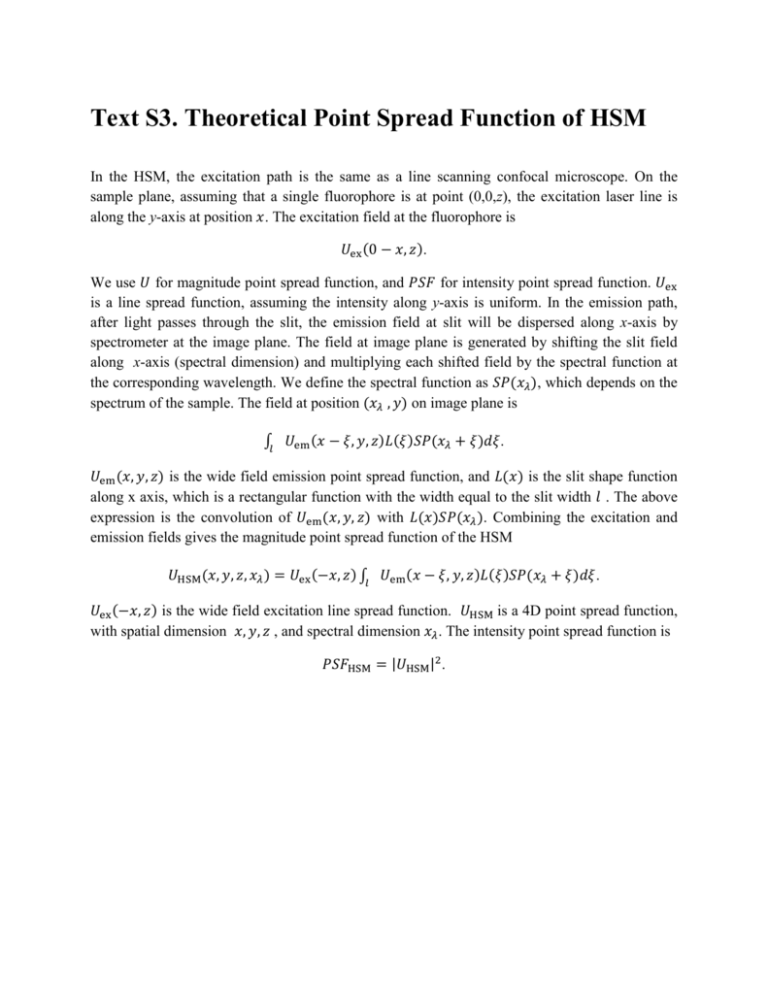
Text S3. Theoretical Point Spread Function of HSM In the HSM, the excitation path is the same as a line scanning confocal microscope. On the sample plane, assuming that a single fluorophore is at point (0,0,z), the excitation laser line is along the y-axis at position 𝑥. The excitation field at the fluorophore is 𝑈ex (0 − 𝑥, 𝑧). We use 𝑈 for magnitude point spread function, and 𝑃𝑆𝐹 for intensity point spread function. 𝑈ex is a line spread function, assuming the intensity along y-axis is uniform. In the emission path, after light passes through the slit, the emission field at slit will be dispersed along x-axis by spectrometer at the image plane. The field at image plane is generated by shifting the slit field along x-axis (spectral dimension) and multiplying each shifted field by the spectral function at the corresponding wavelength. We define the spectral function as 𝑆𝑃(𝑥𝜆 ), which depends on the spectrum of the sample. The field at position (𝑥𝜆 , 𝑦) on image plane is ∫𝑙 𝑈em (𝑥 − 𝜉, 𝑦, 𝑧)𝐿(𝜉)𝑆𝑃(𝑥𝜆 + 𝜉)𝑑𝜉. 𝑈em (𝑥, 𝑦, 𝑧) is the wide field emission point spread function, and 𝐿(𝑥) is the slit shape function along x axis, which is a rectangular function with the width equal to the slit width 𝑙 . The above expression is the convolution of 𝑈em (𝑥, 𝑦, 𝑧) with 𝐿(𝑥)𝑆𝑃(𝑥𝜆 ). Combining the excitation and emission fields gives the magnitude point spread function of the HSM 𝑈HSM (𝑥, 𝑦, 𝑧, 𝑥𝜆 ) = 𝑈ex (−𝑥, 𝑧) ∫𝑙 𝑈em (𝑥 − 𝜉, 𝑦, 𝑧)𝐿(𝜉)𝑆𝑃(𝑥𝜆 + 𝜉)𝑑𝜉 . 𝑈ex (−𝑥, 𝑧) is the wide field excitation line spread function. 𝑈HSM is a 4D point spread function, with spatial dimension 𝑥, 𝑦, 𝑧 , and spectral dimension 𝑥𝜆 . The intensity point spread function is 𝑃𝑆𝐹HSM = |𝑈HSM |2.


