Scientific Method Definitions
advertisement
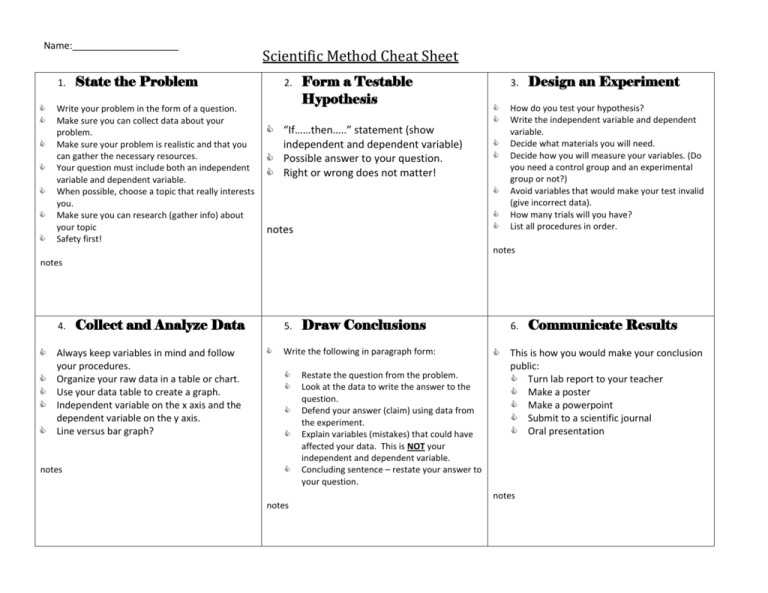
Name:____________________ 1. Scientific Method Cheat Sheet State the Problem Write your problem in the form of a question. Make sure you can collect data about your problem. Make sure your problem is realistic and that you can gather the necessary resources. Your question must include both an independent variable and dependent variable. When possible, choose a topic that really interests you. Make sure you can research (gather info) about your topic Safety first! 2. Form a Testable Hypothesis “If……then…..” statement (show independent and dependent variable) Possible answer to your question. Right or wrong does not matter! 3. notes Design an Experiment How do you test your hypothesis? Write the independent variable and dependent variable. Decide what materials you will need. Decide how you will measure your variables. (Do you need a control group and an experimental group or not?) Avoid variables that would make your test invalid (give incorrect data). How many trials will you have? List all procedures in order. notes notes 4. Collect and Analyze Data Always keep variables in mind and follow your procedures. Organize your raw data in a table or chart. Use your data table to create a graph. Independent variable on the x axis and the dependent variable on the y axis. Line versus bar graph? notes 5. Draw Conclusions Write the following in paragraph form: notes Restate the question from the problem. Look at the data to write the answer to the question. Defend your answer (claim) using data from the experiment. Explain variables (mistakes) that could have affected your data. This is NOT your independent and dependent variable. Concluding sentence – restate your answer to your question. 6. Communicate Results This is how you would make your conclusion public: Turn lab report to your teacher Make a poster Make a powerpoint Submit to a scientific journal Oral presentation notes Scientific Method Definitions Independent Variable – changed on purpose to test hypothesis (cause) Dependent Variable – changes in response to the independent variable (effect) Variables – things that may change the data in your experiment Control Group – something left alone or the same as before to make sure your experiment is valid Experimental Group – part of the experiment in which one thing is different than the control group (independent variable) Trials – do the experiment enough times to make sure you have valid data Data – information gathered during an experiment; this could include measurements and observations Valid – accurate (mistakes were not made in procedures) How to set up a Graph: TAILS 1. Create a Title for your graph. The title should tell people what they are seeing in your graph. 2. Label the x and y Axes, including units. For example, your x-axis may be labeled "hours of sunlight" and your y-axis may be "height of plants." Make sure that your manipulated variable(independent) is on the horizontal x-axis and the responding variable(dependent) is on the vertical y-axis 3. Decide on an appropriate Scale for each axis. Choose a scale that lets you make the graph as large as possible for your paper and data. 4. Choose an Interval that lets you make the graph as large as possible for your paper and data 5. Label your bars or data points. When to Use: Bar graphs Used to show data that are not continuous. Allows us to compare data like amounts or frequency or categories – Allow us to make generalizations about the data – Help us see differences in data Line Graphs – For continuous data – useful for showing trends over time – – Scatterplots – Scatter plots show how much one variable is affected by another. The relationship between two variables is called their correlation. Amount of Fertilizer (kg) 2 4 6 8 10 Number of Leaves 14 14 15 18 16

