Graphing Skills Worksheet: Line & Bar Graphs
advertisement

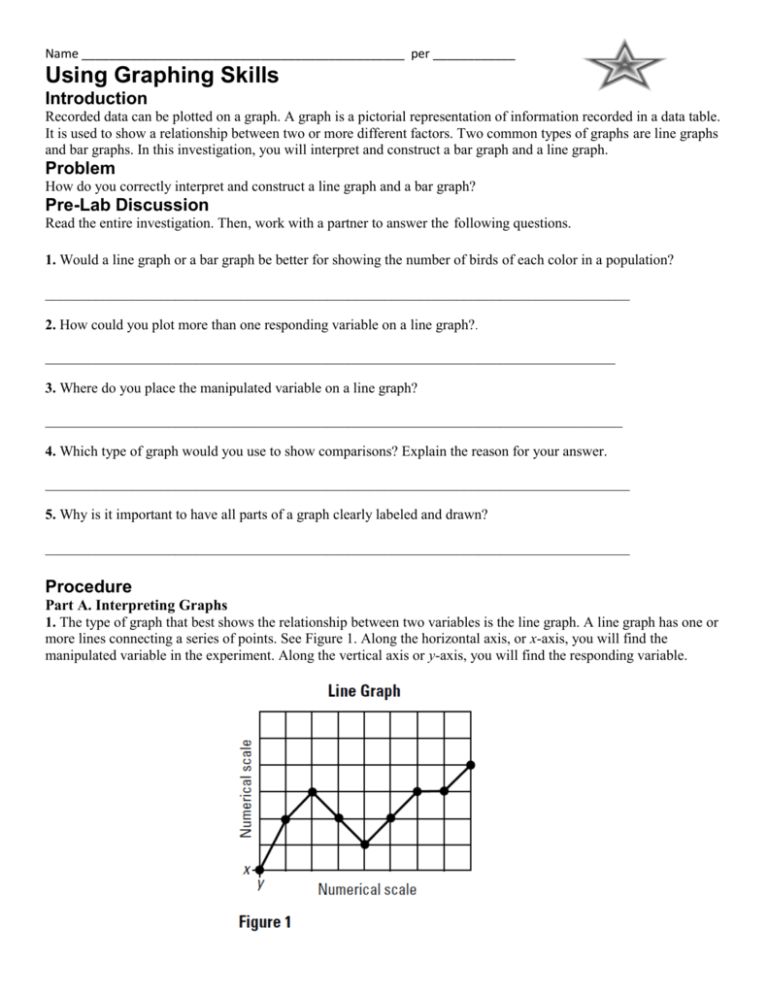
Name _______________________________________________ per ____________ Using Graphing Skills Introduction Recorded data can be plotted on a graph. A graph is a pictorial representation of information recorded in a data table. It is used to show a relationship between two or more different factors. Two common types of graphs are line graphs and bar graphs. In this investigation, you will interpret and construct a bar graph and a line graph. Problem How do you correctly interpret and construct a line graph and a bar graph? Pre-Lab Discussion Read the entire investigation. Then, work with a partner to answer the following questions. 1. Would a line graph or a bar graph be better for showing the number of birds of each color in a population? _________________________________________________________________________________ 2. How could you plot more than one responding variable on a line graph?. _______________________________________________________________________________ 3. Where do you place the manipulated variable on a line graph? ________________________________________________________________________________ 4. Which type of graph would you use to show comparisons? Explain the reason for your answer. _________________________________________________________________________________ 5. Why is it important to have all parts of a graph clearly labeled and drawn? _________________________________________________________________________________ Procedure Part A. Interpreting Graphs 1. The type of graph that best shows the relationship between two variables is the line graph. A line graph has one or more lines connecting a series of points. See Figure 1. Along the horizontal axis, or x-axis, you will find the manipulated variable in the experiment. Along the vertical axis or y-axis, you will find the responding variable. 2. Use the line graph below in Figure 2 to answer questions a through f a. Which plant grew the tallest? _________________________________________________________________________________ b. How many plants grew to be at least 6 cm tall? _________________________________________________________________________________ c. Which plant grew the fastest in the first five days? _________________________________________________________________________________ d. Which line represents plant 2? _________________________________________________________________________________ e. After 10 days, how much had plant 3 grown? _________________________________________________________________________________ f. How long did it take for plant 1 to grow 6 cm? _________________________________________________________________________________ 3. A bar graph is another way of showing relationships between variables. A bar graph also contains an x-axis and a y-axis. But instead of points, a bar graph uses a series of columns to display data. See Figure 3. On some bar graphs, the x-axis has labels rather than a numerical scale. This type of bar graph is used only to show comparisons. 4. Use the bar graph in Figure 4 to answer questions a through e below. a. At birth, what is the average number of red blood cells per mm3 of blood? _________________________________________________________________________________ b. What appears to happen to the number of red blood cells between birth and 2 months? _________________________________________________________________________________ c. What happens to the number of red blood cells between the ages of 6 and 8 years? _________________________________________________________________________________ d. Between what ages is a human likely to have 4.6 million red blood cells? _________________________________________________________________________________ e. After 14 years of age, do males or females have a higher red blood cell count? _________________________________________________________________________________ Part B. Constructing Graphs 1. When plotting data on a graph, you must decide which variable to place along the x-axis and which variable to place along the y-axis. Label the axes of your graph accordingly. Then you must decide on the scale of each axis; that is, how much each unit along the axis represents. Scales should be chosen to make the graph as large as possible within the limits of the paper and still include the largest item of data. If the scale unit is too large, your graph will be cramped into a small area and will be hard to read and interpret. If the scale unit is too small, the graph will run off the paper. Scale units should also be selected for ease of locating points on the graph. Multiples of 1, 2, 5, or 10 are easiest to work with. 2. Use the information recorded in Data Table 1 to construct a line graph on the grid provided below. You should label each axis, mark an appropriate scale on each axis, plot the data, connect the points, and give your graph a title. Data Table 1 Breathing Rate of the Freshwater Sunfish 3. Use the information recorded in Data Table 2 to construct a bar graph on the grid provided below. You should label each axis, mark an appropriate scale on each axis, plot the data, darken the columns of the graph, and give your graph a title. Data Table 2 Average Rainfall in Willamette Valley 1. Comparing and Contrasting How is a graph similar to a data table? _________________________________________________________________________________ 2. Comparing and Contrasting How is a line graph different from a bar graph? _________________________________________________________________________________ 3. Using Graphs Does a steep curve on a line graph indicate a rapid or slow rate of change? _________________________________________________________________________________ 4. Using Graphs You are conducting an experiment to measure the gain in mass of a young mouse over a ten-week period. In constructing a graph to represent your data, which variable should you place along the x-axis and which variable should you place along the y-axis? Explain your answer. _________________________________________________________________________________ _________________________________________________________________________________ _________________________________________________________________________________ 5. Using Graphs What is an advantage of using multiple lines in a line graph? (See Figure 2.) _________________________________________________________________________________


