What is Master Production Schedule or MPS?
3 rd. year -Industrial Eng. Chapter 3 Production Planning & control
2011- 2012 Dr. May George
What is Master Production Schedule or MPS?
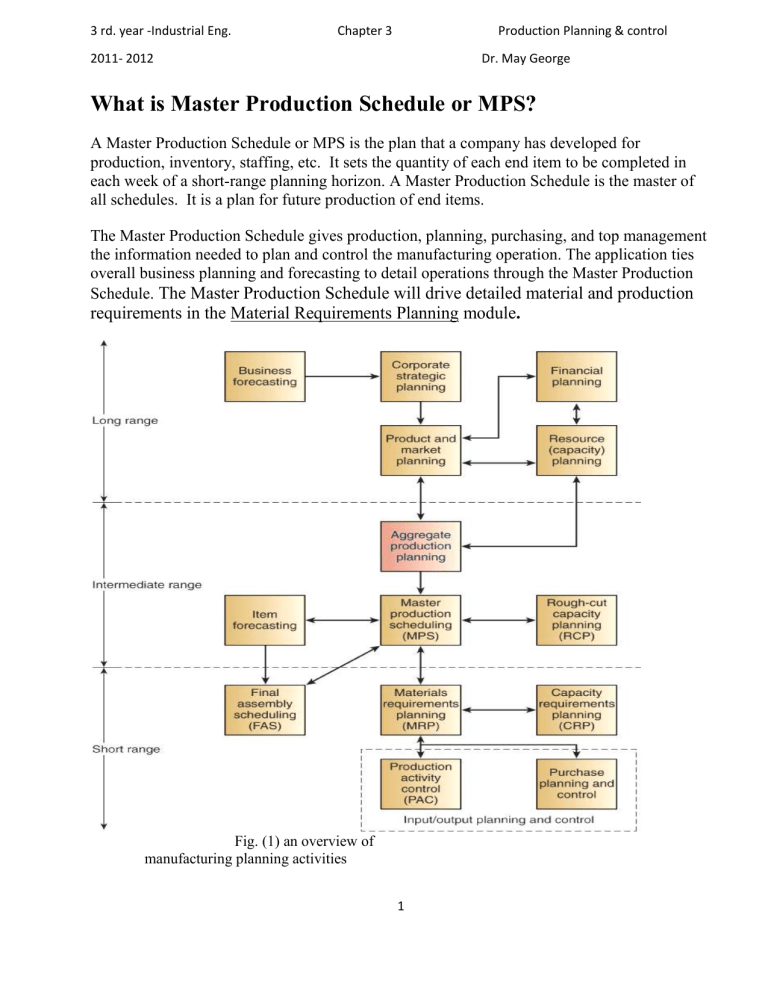
A Master Production Schedule or MPS is the plan that a company has developed for production, inventory, staffing, etc. It sets the quantity of each end item to be completed in each week of a short-range planning horizon. A Master Production Schedule is the master of all schedules. It is a plan for future production of end items.
The Master Production Schedule gives production, planning, purchasing, and top management the information needed to plan and control the manufacturing operation. The application ties overall business planning and forecasting to detail operations through the Master Production
Schedule.
The Master Production Schedule will drive detailed material and production requirements in the Material Requirements Planning module .
Fig. (1) an overview of manufacturing planning activities
1
3 rd. year -Industrial Eng. Chapter 3 Production Planning & control
2011- 2012 Dr. May George
MPS INPUTS:
1.
Forecast Demand
2.
Production Costs
3.
Inventory Costs
4.
Customer Orders
5.
Inventory Levels
6.
Supply
7.
Lot Size
8.
Production Lead Time
9.
Capacity
MPS OUTPUT (production plan):
1.
Amounts to be Produced
2.
Staffing Levels
3.
Quantity Available to Promise
4.
Projected Available Balance
A comparison of different product type strategies are depicted in the fig. below:
Type A Type X Type V
Fig.(2) a comparison of MPS, BOM and FAS MTS=Make To Stock, ATO= Assemble To Order
2
3 rd. year -Industrial Eng. Chapter 3 Production Planning & control
2011- 2012 Dr. May George
MTO= Make To Order FAS= Final Assemble Scheduledule
Materials requirements planning
Materials requirements planning (MRP) is used for determining the number of parts, components, and materials needed to produce a product ( end item). In brief, MRP is a means designed to answer what, when, how many for each part, component, subassemblies and final products. MRP is most valuable in industries where products are assembled in batches (batch shop, assemble to stock, assemble to order.)
MRP provides time scheduling information specifying when each of the subassemblies, parts, and components should be ordered or produced.
The objectives of MRP are to determine quantity and timing of material requirements to keep schedule priorities updated and valid.
MRP needs three inputs :
1.
The authorized MPS,
2.
The BOM file, and
3.
The inventory records file.
Once the MPS has been input, MRP checks inventory availability. If a need is determined, MRP checks the BOM file for material needed, and then generates planned orders.
MRP outputs are :
1.
Planned orders to be released at a future time.
2.
Order release notices to execute the planned orders.
3.
Changes in due dates of open orders due to rescheduling.
4.
Cancellations or suspensions of open orders due to cancellation or suspension of orders on the master production schedule .
Inventory status data: Planned order releases.
The inventory records consist of:
1.
Gross requirements: The total period demand for the item
2.
Scheduled receipts: An open order with an assigned due date
3.
Projected available: The projected inventory balance for the period
4.
Planned orders: Quantities & released dates suggested by the MRP system
3
3 rd. year -Industrial Eng. Chapter 3 Production Planning & control
2011- 2012 Dr. May George
MRP System
Fig. (3) MRP system
Material Requirements Planning can provide the following benefits:
1.
Reduced Inventory Levels
2.
Reduced Component Shortages
3.
Improved Shipping Performance
4.
Improved Customer Service
5.
Improved Productivity
6.
Simplified and Accurate
Scheduling
7.
Reduced Purchasing Cost
8.
Improve Production Schedules
9.
Reduced Manufacturing Cost
10.
Reduced Lead Times
11.
Less Scrap and Rework
12.
Higher Production Quality
13.
Improved Communication
14.
Improved Plant Efficiency
15.
Reduced Freight Cost
16.
Reduction in Excess Inventory
17.
Reduced Overtime
18.
Improved Supply Schedules
19.
Improved Calculation of Material
Requirements
20.
Improved Competitive Position
4
3 rd. year -Industrial Eng. Chapter 3 Production Planning & control
2011- 2012 Dr. May George
Bill Of Materials:
BOM: a listing of all of the raw materials, parts, subassemblies, and assemblies, purchased and manufactured needed to produce one unit of a product.
Product structure tree: Visual depiction of the requirements in a bill of materials, where all components are listed by levels.
Some terms used with MRP:
Time bucket : period, usually 1 week.
Planning horizon : number of periods, then this is divided into time fences.
Lead time offset : offsets a planned order release from a required replenishment.
Net requirement : difference between the gross requirements and the available inventory.
Gross requirements : anticipated future usage of (or demand for) the item during each period.
Scheduled receipts : existing replenishment orders due in at the beginning of the period.
Projected on hand : projected inventory status for the item at the beginning of each period.
Net requirements: Gross Requirements minus Scheduled Receipts minus
Projected on hand.
Planned order receipt: planned receipt of replenishment orders at the beginning of the period.
Planned order release: release of planned replenishment orders for the item using lead-time offset.
Time Fences
A policy or guideline established to note where various restrictions or changes in operating procedures take place. For example, changes to the master production schedule can be accomplished easily beyond the cumulative lead time, while changes inside the cumulative lead time become increasingly more difficult to a point where changes should be resisted. Time fences can be used to define these points.
Time Zones
1-Frozen Zone
5
3 rd. year -Industrial Eng. Chapter 3 Production Planning & control
2011- 2012 Dr. May George
In forecasting, this is the period in which no changes can be made to scheduled work orders based on changes in demand. Use of a frozen zone provides stability in the manufacturing schedule.
2- Firm planned order (FPO):
A planned order that can be frozen in quantity and time. The computer is not allowed to change it automatically; this is the responsibility of the planner in charge of the item that is being planned. This technique can aid planners working with MRP systems to respond to material and capacity problems by firming up selected planned orders. In addition, firm planned orders are the normal method of stating the master production schedule.
3- Slushy Zone
Capacity and material are committed to less extent. Tradeoffs must be met between marketing and manufacturing
4- Liquid Zone
Any changes can be made to the MPS
Fig (4) time zones with allowances.
Fig.(5) product structure tree without lead time
6
3 rd. year -Industrial Eng. Chapter 3 Production Planning & control
2011- 2012 Dr. May George
Master Production Schedule Record an Example:
In Make-to-stock environment, with fixed orders of 125 units. There are 110 units in inventory to start. When is new order (quantities) needed to satisfy the forecasted demand?
For a given product, the demand for 12 months, and Projected available are listed in the table (1). The calculation will follow these equations (lead times, lot size and time fence: fixed period, must be known):
Projected Available = beginning inventory + MPS shipments – forecasted demand .
The MPS row shows when replenishment shipments need to arrive to avoid a stock out (negative projected available just to show the calculation)
W e e k B I 1 2 3 4 5 6 7 8 9 1 0 1 1 1 2
5 0 7 5 7 5 7 5 7 5 5 0 5 0 5 0 5 0 F o re c a s t
P ro je c t e d a va ila b le 1 1 0
M P S
5 0
6 0
5 0
1 0
5 0
-4 0
W e e k B I
F o re c a s t
P ro je c t e d a va ila b le 1 1 0
M P S
1
5 0
6 0
2
5 0
1 0
3
5 0
8 5
1 2 5
4
5 0
3 5
5
7 5
-4 0
6
7 5
7
7 5
8
7 5
9
5 0
1 0
5 0
1 1
5 0
1 2
5 0
W e e k B I 1 2 3 4 5 6 7 8 9 1 0 1 1 1 2
F o re c a s t 5 0 5 0 5 0 5 0 7 5 7 5 7 5 7 5 5 0 5 0 5 0 5 0
P ro je c t e d a va ila b le 1 1 0 6 0 1 0 -6 5 1 0 8 5
1 2 5
3 5 8 5
1 2 5 M P S
W e e k B I 1 2 3 4 5 6 7 8 9 1 0 1 1 1 2
F o re c a s t 5 0
P ro je c t e d a va ila b le 1 1 0 6 0
M P S
5 0 5 0 5 0 7 5 7 5 7 5 7 5 5 0 5 0
1 0 8 5
1 2 5
3 5 8 5
1 2 5
7
1 0 6 0 1 1 0 6 0
1 2 5 1 2 5
5 0 5 0
1 0 8 5 3 5
1 2 5
3 rd. year -Industrial Eng. Chapter 3 Production Planning & control
2011- 2012 Dr. May George
And a typical Product structure diagram is shown in fig. below:
Fig.(6) Product structure diagram for product X with lead times.
Assume 1 week to assemble X, to calculate the lead times for each part and then we have to set parts and the Quantities of Product -X in the table below: parts
X
A quantity
500
2
Unit scale each
Lead time(week)
1
1
Items Q.
500
500X2
Total Q.
500
1000
B
C
D
E
1
3
2
3
=
=
=
=
2
2
1
2
500X1
500X3
500X2
500X3
500
1500
1000
1500
C
E
D
Asub
B- sub assemble
X: end product product
5 weeks 4 3 2 1 0
Fig. (7) lead times for Product X
8
3 rd. year -Industrial Eng. Chapter 3 Production Planning & control
2011- 2012 Dr. May George
Time-phased Bills: lead time scheduling:
Forward scheduling: start at today‘s date and schedule forward to determine the earliest date the job can be finished. If each item takes one period to complete, the clipboards can be finished in three periods.
Backward scheduling: start at the due date and schedule backwards to determine when to begin work. If an order for clipboards is due by period three, we should start production now.
Lot sizing rules:
For purchased items or for technical reasons, there may be a minimum or maximum order sizes .Purchased items/subassemblies may require multiples of predetermined amounts (e.g., multiples of 50).
Rules are used to change the frequency of replenishment orders & set the quantity of each order (balance holding & ordering costs to reduce total costs).
Common rules used for lot sizing determination are:
Lot-for-lot ordering policy
: Lot-for-Lot (L4Lor LFL ) you plan using lotfor-lot order quantity, when you want to procure the exact lot size again. Lots as required or planned.
Fixed-size lot ordering policy
(FOQ ): It is useful to select a fixed lot size for a material, if it is only delivered, for example, in pallets of a certain quantity or in tanks of a certain size.
Minimum order quantities
Maximum order quantities
Multiple order quantities
Economic order quantity
Periodic order quantity
Example Comparing Lot Size Rules: Three common lot sizing rules used within MRP
Systems are fixed order quantity (FOQ), lot for lot (L4L), and period order quantity
9
3 rd. year -Industrial Eng. Chapter 3 Production Planning & control
2011- 2012 Dr. May George
(POQ). Cost comparison is based on Inventory holding costs ($0.10 per period) and ordering cost ($25 per order). In this example POQ is best at $133.50.
10
