Earthquake Lab
advertisement
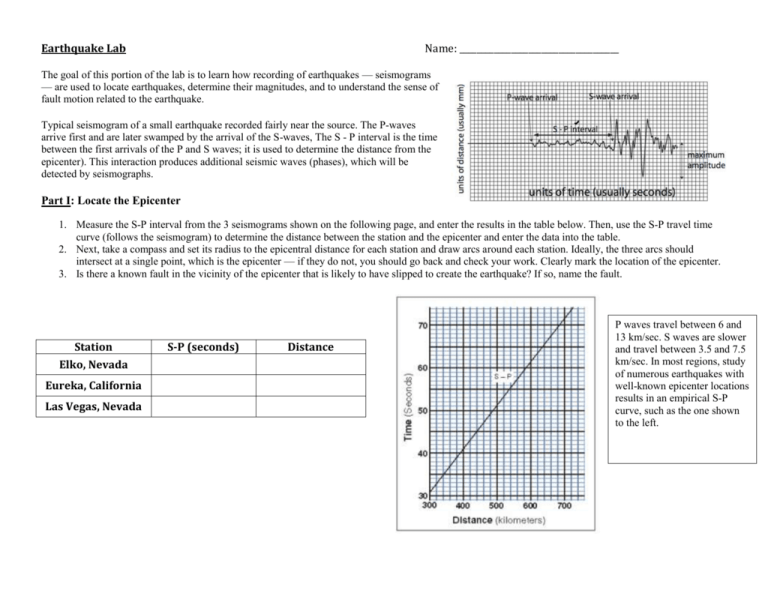
Earthquake Lab Name: _____________________________________ The goal of this portion of the lab is to learn how recording of earthquakes — seismograms — are used to locate earthquakes, determine their magnitudes, and to understand the sense of fault motion related to the earthquake. Typical seismogram of a small earthquake recorded fairly near the source. The P-waves arrive first and are later swamped by the arrival of the S-waves, The S - P interval is the time between the first arrivals of the P and S waves; it is used to determine the distance from the epicenter). This interaction produces additional seismic waves (phases), which will be detected by seismographs. Part I: Locate the Epicenter 1. Measure the S-P interval from the 3 seismograms shown on the following page, and enter the results in the table below. Then, use the S-P travel time curve (follows the seismogram) to determine the distance between the station and the epicenter and enter the data into the table. 2. Next, take a compass and set its radius to the epicentral distance for each station and draw arcs around each station. Ideally, the three arcs should intersect at a single point, which is the epicenter — if they do not, you should go back and check your work. Clearly mark the location of the epicenter. 3. Is there a known fault in the vicinity of the epicenter that is likely to have slipped to create the earthquake? If so, name the fault. Station Elko, Nevada Eureka, California Las Vegas, Nevada S-P (seconds) Distance P waves travel between 6 and 13 km/sec. S waves are slower and travel between 3.5 and 7.5 km/sec. In most regions, study of numerous earthquakes with well-known epicenter locations results in an empirical S-P curve, such as the one shown to the left. Use a compass and the table from page 1 to determine the location of the earthquake. Location: ___________________________________ Part II: Magnitude of the Earthquake The magnitude of an earthquake provides a convenient measure of its size scaled to a small number usually less than 9. It is a unit less number, derived from the amplitude of ground motion associated with S-waves, adjusted for the distance between the epicenter and the seismograph station (the amplitude generally drops off with distance from epicenter). The table below helps puts earthquake magnitudes into perspective. 1. Measure the maximum amplitude of the S-waves from the 3 seismograms, and enter the results in the table below; add the distances from epicenter you obtained in the previous problem. Station Distance from Epicenter (km) Max S-wave Amplitude (mm) Magnitude Elko, Nevada Eureka, California Las Vegas, Nevada 2. Then, use the graphical device on the next (called a nomogram) to determine the Richter magnitude of the earthquake as indicated by each of the three seismograms. Ideally, they should all converge on a single answer — if they do not, you should go back and check your work. List the magnitude below the diagram on the next page. Magnitude of the Earthquake: ________________________ Part III: Magnitude of Earthquakes and Time On average, the North American Plate and the Pacific Plate are moving past each other at about 5.0 cm/yr, but this slip is distributed along many separate faults. In some locations, the plates grind past each other at lower rate causing pressure to build and then finally slip, leading to earthquakes. The best movement estimate for the San Andreas Fault (a section where the North American and Pacific Plate intersect) is 14 mm/yr. Use the table to the right to estimate the approximate magnitude of an earthquake over the timeframes listed below: (there are 10 mm in 1 cm, 1000 mm in 1 m, and 100 cm in 1 m) 1. 11 years Magnitude: ___________________ 2. 1100 years Magnitude: ___________________ Magnitude Avg. Slip 8 4m 7 1.4 m 6 40 cm 5 10 cm 3. In areas where plates intersect, what will lead to more earthquakes, slower moving plates or faster moving plates? Explain your answer below.
