rcm7124-sup-0001-documentS1
advertisement

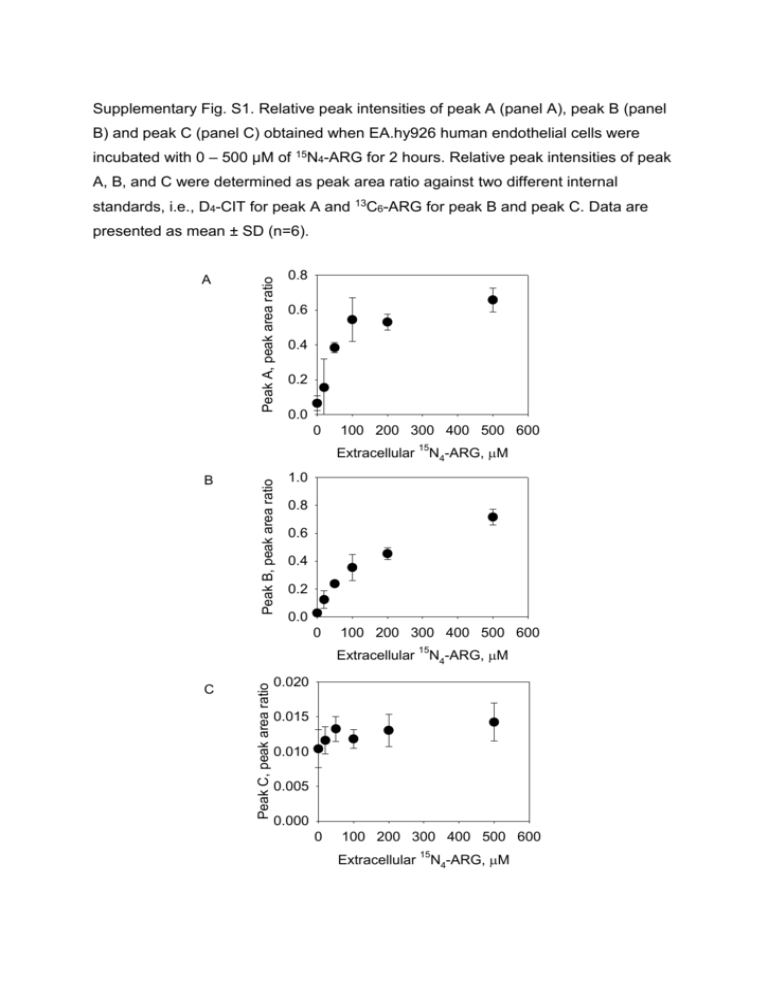
Supplementary Fig. S1. Relative peak intensities of peak A (panel A), peak B (panel B) and peak C (panel C) obtained when EA.hy926 human endothelial cells were incubated with 0 – 500 µM of 15N4-ARG for 2 hours. Relative peak intensities of peak A, B, and C were determined as peak area ratio against two different internal standards, i.e., D4-CIT for peak A and 13C6-ARG for peak B and peak C. Data are A Peak A, peak area ratio presented as mean ± SD (n=6). 0.8 0.6 0.4 0.2 0.0 0 100 200 300 400 500 600 B Peak B, peak area ratio Extracellular 15N4-ARG, M 1.0 0.8 0.6 0.4 0.2 0.0 0 100 200 300 400 500 600 C Peak C, peak area ratio Extracellular 15N4-ARG, M 0.020 0.015 0.010 0.005 0.000 0 100 200 300 400 500 600 Extracellular 15N4-ARG, M Supplementary Fig. S2. Correlations between relative peak intensity of 15N-nitrite (panel A) and relative peak intensity of 15N -ARG 3 15N -CIT 3 vs. vs. 15N-nitrite (panel B) after EA.hy926 human endothelial cells were incubated with 0 – 500 µM of 15N4-ARG for 2 hours (n=6 for each concentration). The peak intensity of 15N3-ARG was corrected for its presence as an impurity of 15N -ARG. 4 0.7 15 N3-CIT, peak area ratio A 0.6 0.5 0.4 0.3 0.2 0.1 0.0 0 10 20 15 40 30 40 N-nitrite, nM N3-ARG, peak area ratio 0.20 0.15 0.10 0.05 15 B 30 0.00 0 10 20 15 N-nitrite, nM Supplementary Fig. S3. Correlations between 15N3-CIT vs. 15N-nitrite (black symbols; p=0.862, R2=0.740) and 15N3-CIT+15N3-ARG vs. 15N-nitrite (red symbols; p=0.865, R2=0,744) after EA.hy926 human endothelial cells were incubated with 0 – 500 µM of 15N4-ARG for 2 hours (n=6 for each concentration, each point represents an individual run). The solid lines represent the linear regression of each correlation when the y-intercept was set at 0. Estimated concentration, nM 700 600 15 N3-CIT 15 N3-CIT+15N3-ARG 500 400 300 200 100 0 0 10 20 15 N-Nitrite, nM 30 40 Supplementary Fig. S4. Production of 15N3-CIT and nitrite and nitrate in the cell lysates when cell lysates were exposed to 0 – 100 µM of 15N4-ARG for 30 min (n=3 for each concentration). 15N3-CIT were measured as described in the materials and methods and nitrite and nitrate concentrations were determined by Ultrasensitive Colorimetric Assay for Nitric Oxide Synthase kit (Oxford Biomedical Research, Inc., v, pmol/mg/min Oxford, MI). 120 100 80 60 40 20 15 N3-CIT Nitrite+Nitrate 4 2 0 0 20 40 60 80 15N -ARG concentration, M 4 100 120 Supplementary Fig. S5. Schematic representation of metabolic fates of 14C-ARG. The radioisotope labeling is set on the ureido-carbon atom. It is noted that CIT→ARG recycling does not generate any additional 14C-CIT, although 14C-ARG is re-generated along with unlabeled NO. ASS; Argininosuccinate synthase, ASL; argininosuccinate lyase. 14C-argininosuccinate Aspartate 14C-ARG 14C-CIT Fumarate 14C-ARG Supplementary Fig. S6. Stability of 15N4-ARG (A) in the cell incubation medium and (B) cell lysate mixture. 15N4-ARG concentrations were determined at 0 – 120 min incubation in the blank cell incubation medium or cell lysate. Supplementary Fig. S7. Production of 15N3-CIT (A) in the cell lysates when cell lysates were incubated with 10 µM of 15N4-ARG and (B) in the intact cells when cells were incubated with 100 µM 15N4-ARG. A 4 3 2 1 15 15 3 N3-CIT, pmol/mg protein N -CIT, pmol/mg protein 5 0 0 10 20 30 40 50 60 Time,min min Time, 120 15 15 N protein N33-CIT, -CIT,pmol/mg pmol/mgprotein B 100 80 60 40 20 0 0 20 40 60 80 min Time, min 100 120 70


