Mapping Abundances to Peak Intensities for Virtual MALDI
advertisement
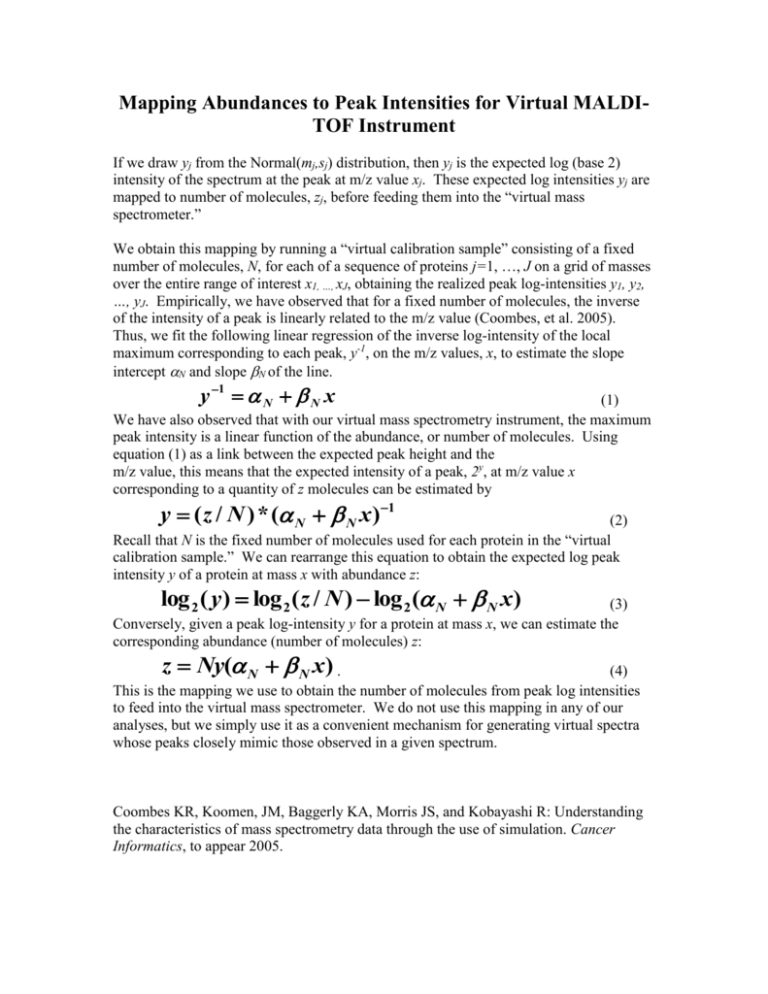
Mapping Abundances to Peak Intensities for Virtual MALDITOF Instrument If we draw yj from the Normal(mj,sj) distribution, then yj is the expected log (base 2) intensity of the spectrum at the peak at m/z value xj. These expected log intensities yj are mapped to number of molecules, zj, before feeding them into the “virtual mass spectrometer.” We obtain this mapping by running a “virtual calibration sample” consisting of a fixed number of molecules, N, for each of a sequence of proteins j=1, …, J on a grid of masses over the entire range of interest x1, …, xJ, obtaining the realized peak log-intensities y1, y2, …, yJ. Empirically, we have observed that for a fixed number of molecules, the inverse of the intensity of a peak is linearly related to the m/z value (Coombes, et al. 2005). Thus, we fit the following linear regression of the inverse log-intensity of the local maximum corresponding to each peak, y-1, on the m/z values, x, to estimate the slope intercept N and slope N of the line. y 1 N N x (1) We have also observed that with our virtual mass spectrometry instrument, the maximum peak intensity is a linear function of the abundance, or number of molecules. Using equation (1) as a link between the expected peak height and the m/z value, this means that the expected intensity of a peak, 2y, at m/z value x corresponding to a quantity of z molecules can be estimated by y ( z / N ) * ( N N x )1 (2) Recall that N is the fixed number of molecules used for each protein in the “virtual calibration sample.” We can rearrange this equation to obtain the expected log peak intensity y of a protein at mass x with abundance z: log 2 ( y) log 2 ( z / N ) log 2 ( N N x) (3) Conversely, given a peak log-intensity y for a protein at mass x, we can estimate the corresponding abundance (number of molecules) z: z Ny( N N x ) . (4) This is the mapping we use to obtain the number of molecules from peak log intensities to feed into the virtual mass spectrometer. We do not use this mapping in any of our analyses, but we simply use it as a convenient mechanism for generating virtual spectra whose peaks closely mimic those observed in a given spectrum. Coombes KR, Koomen, JM, Baggerly KA, Morris JS, and Kobayashi R: Understanding the characteristics of mass spectrometry data through the use of simulation. Cancer Informatics, to appear 2005.


