Scatter Plot LSRL Guide for TI-83-84
advertisement
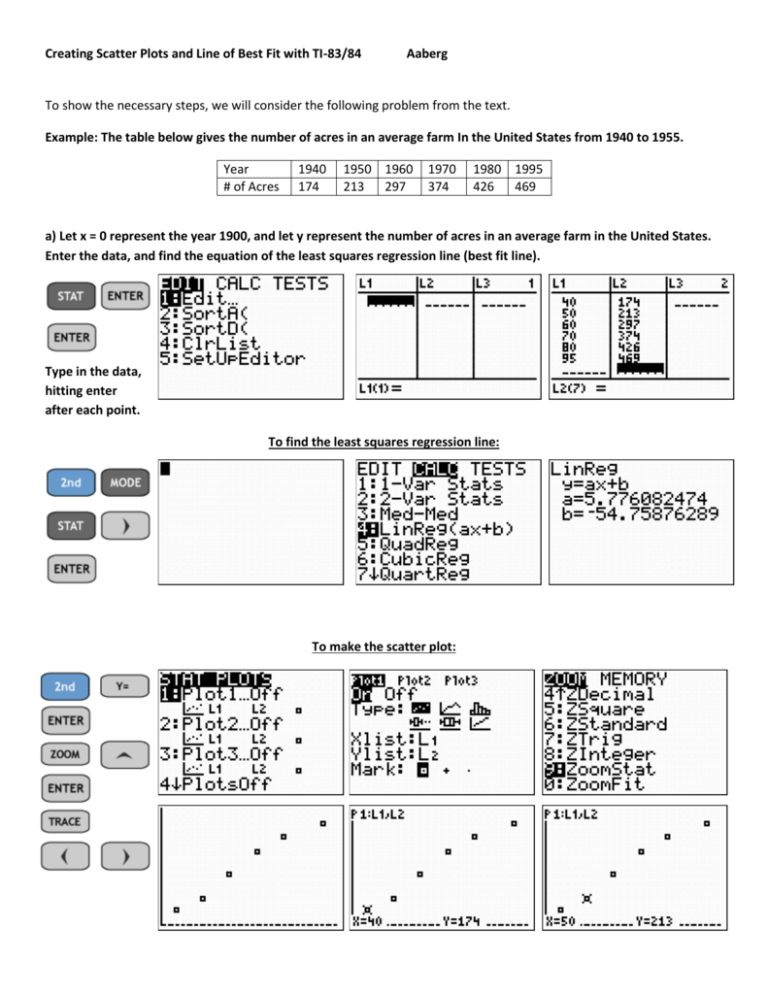
Creating Scatter Plots and Line of Best Fit with TI-83/84 Aaberg To show the necessary steps, we will consider the following problem from the text. Example: The table below gives the number of acres in an average farm In the United States from 1940 to 1955. Year # of Acres 1940 174 1950 1960 213 297 1970 374 1980 1995 426 469 a) Let x = 0 represent the year 1900, and let y represent the number of acres in an average farm in the United States. Enter the data, and find the equation of the least squares regression line (best fit line). Type in the data, hitting enter after each point. To find the least squares regression line: To make the scatter plot: To copy and paste the least squares regression line (so you can graph it): b) Find the correlation coefficient, r, to the nearest hundredth. Explain what the value of r tells you about the data. Since the r value is very close to +1, we would say this is a very strong positive correlation. There is definitely a strong linear relationship between the year and number of acres in an average U.S. farm. c) Use the least-squares line to estimate the number of acres in an average farm in 1955. According to the LSRL, there were approximately 263 acres on the average U.S. farm in 1955.
