graphing periodic trends
advertisement
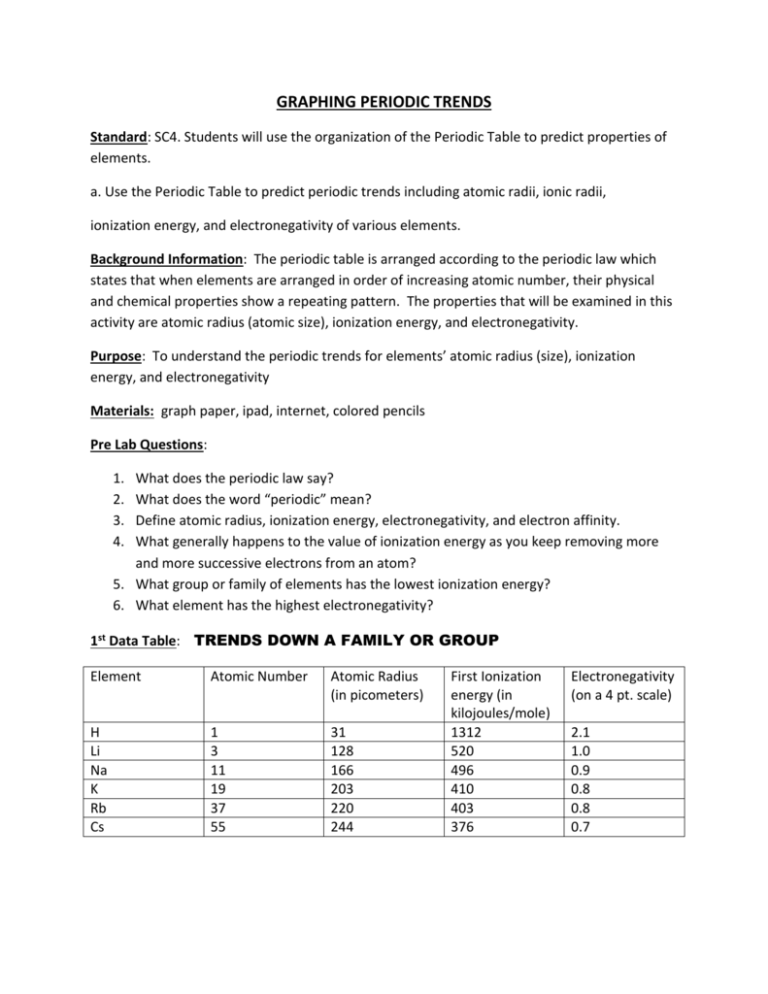
GRAPHING PERIODIC TRENDS Standard: SC4. Students will use the organization of the Periodic Table to predict properties of elements. a. Use the Periodic Table to predict periodic trends including atomic radii, ionic radii, ionization energy, and electronegativity of various elements. Background Information: The periodic table is arranged according to the periodic law which states that when elements are arranged in order of increasing atomic number, their physical and chemical properties show a repeating pattern. The properties that will be examined in this activity are atomic radius (atomic size), ionization energy, and electronegativity. Purpose: To understand the periodic trends for elements’ atomic radius (size), ionization energy, and electronegativity Materials: graph paper, ipad, internet, colored pencils Pre Lab Questions: 1. 2. 3. 4. What does the periodic law say? What does the word “periodic” mean? Define atomic radius, ionization energy, electronegativity, and electron affinity. What generally happens to the value of ionization energy as you keep removing more and more successive electrons from an atom? 5. What group or family of elements has the lowest ionization energy? 6. What element has the highest electronegativity? 1st Data Table: TRENDS DOWN A FAMILY OR GROUP Element Atomic Number Atomic Radius (in picometers) H Li Na K Rb Cs 1 3 11 19 37 55 31 128 166 203 220 244 First Ionization energy (in kilojoules/mole) 1312 520 496 410 403 376 Electronegativity (on a 4 pt. scale) 2.1 1.0 0.9 0.8 0.8 0.7 2nd Data Table: TRENDS ACROSS A PERIOD OR SERIES Element Atomic number Atomic Radius (in picometers) Na Mg Al Si P S Cl 11 12 13 14 15 16 17 166 141 121 111 107 105 102 First Ionization energy (in kilojoules/mole) 496 738 578 787 1012 1000 1251 Electronegativity (on a 4 pt. scale) 0.9 1.2 1.5 1.8 2.1 2.5 3.0 Procedure: 1. Using the graph paper provided by your teacher, graph the FIRST data table. Give the graph a correct title AND label the x axis “atomic number” vs. the y axis “periodic property”. Divide the graph paper into 3 sections: 1st section will be for atomic number vs. atomic radius (use a blue line for this section); the 2nd section will be for atomic number vs. first ionization energy (use a red line for this section); the 3rd section will be for atomic number vs. electronegativity (use a green line for this section). 2. Using the graph paper provided by your teacher, graph the SECOND data table. Give the graph a correct title AND label the x axis “atomic number” vs. the y axis “periodic property”. Divide the graph paper into 3 sections: 1st section will be for atomic number vs. atomic radius (use a blue line for this section); the 2nd section will be for atomic number vs. first ionization energy (use a red line for this section); the 3rd section will be for atomic number vs. electronegativity (use a green line for this section). Conclusions: 1. In general, what happens to atomic radius (atomic size) as you go down a group or family? 2. In general, what happens to ionization energy as you go down a group or family? 3. In general, what happens to electronegativity as you go down a group or family? 4. In general, what happens to atomic radius (atomic size) as you go across a period or series? 5. In general, what happens to ionization energy as you go across a period or series? 6. In general, what happens to electronegativity as you go across a period or series?
