Supporting Info.LT-STM N-Pt(111)-v5
advertisement
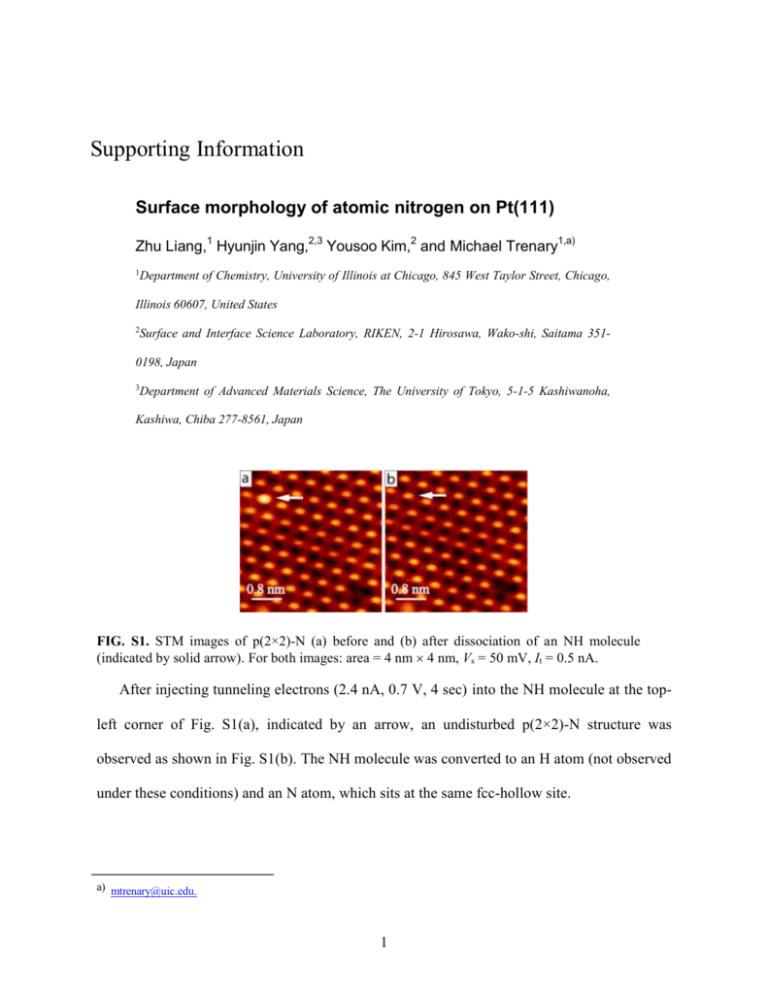
Supporting Information Surface morphology of atomic nitrogen on Pt(111) Zhu Liang,1 Hyunjin Yang,2,3 Yousoo Kim,2 and Michael Trenary1,a) 1 Department of Chemistry, University of Illinois at Chicago, 845 West Taylor Street, Chicago, Illinois 60607, United States 2 Surface and Interface Science Laboratory, RIKEN, 2-1 Hirosawa, Wako-shi, Saitama 351- 0198, Japan 3 Department of Advanced Materials Science, The University of Tokyo, 5-1-5 Kashiwanoha, Kashiwa, Chiba 277-8561, Japan FIG. S1. STM images of p(2×2)-N (a) before and (b) after dissociation of an NH molecule (indicated by solid arrow). For both images: area = 4 nm 4 nm, Vs = 50 mV, It = 0.5 nA. After injecting tunneling electrons (2.4 nA, 0.7 V, 4 sec) into the NH molecule at the topleft corner of Fig. S1(a), indicated by an arrow, an undisturbed p(2×2)-N structure was observed as shown in Fig. S1(b). The NH molecule was converted to an H atom (not observed under these conditions) and an N atom, which sits at the same fcc-hollow site. a) mtrenary@uic.edu. 1 FIG. S2. Model of p(2×2)-N. N atom occupies (a) fcc-hollow site; (b) hcp-hollow site. Blue and purple rhombuses indicate the unit cells of p(2×2)-N and p(2×2)-Pt, respectively. Nitrogen atoms are colored blue, Pt (visible) purple, and Pt (2nd layer) brown. A triangle in the six-membered ring connects three Pt atoms that are visible in STM images, and is centered at the hollow of that ring. Such a triangle in Fig. S1(a) is rotated by 60° compared to that in Fig. S1(b) if the N atoms sit at different hollow sites. Rotated triangles are not observed in the images. FIG. S3. Polarity effects on the appearance of p(2×2)-N. For all images, area = 3 nm × 3 nm, It = 0.6 nA. (a) Vs = ±10 mV (17 MΩ); (b) Vs = ±50 mV (50 MΩ). Blue and black circles indicate the position of N and Pt atoms, respectively. In Fig. S3(a) and (b), images in the upper panels were obtained at negative sample bias (−), while those in the bottom panels were obtained at positive sample bias (+). In Fig. S3(a), images are almost identical under (+) and (−) biases. In Fig. S3(b), the relative brightness (apparent height) of a Pt atom to a N atom is slightly higher under (+) bias than that under (−) bias. However, inversion of contrast was not observed, which means Pt atoms are always brighter than N atoms under either (+) or (−) biases at 50 MΩ gap resistance. 2


