Wind-Lab-Day-1
advertisement

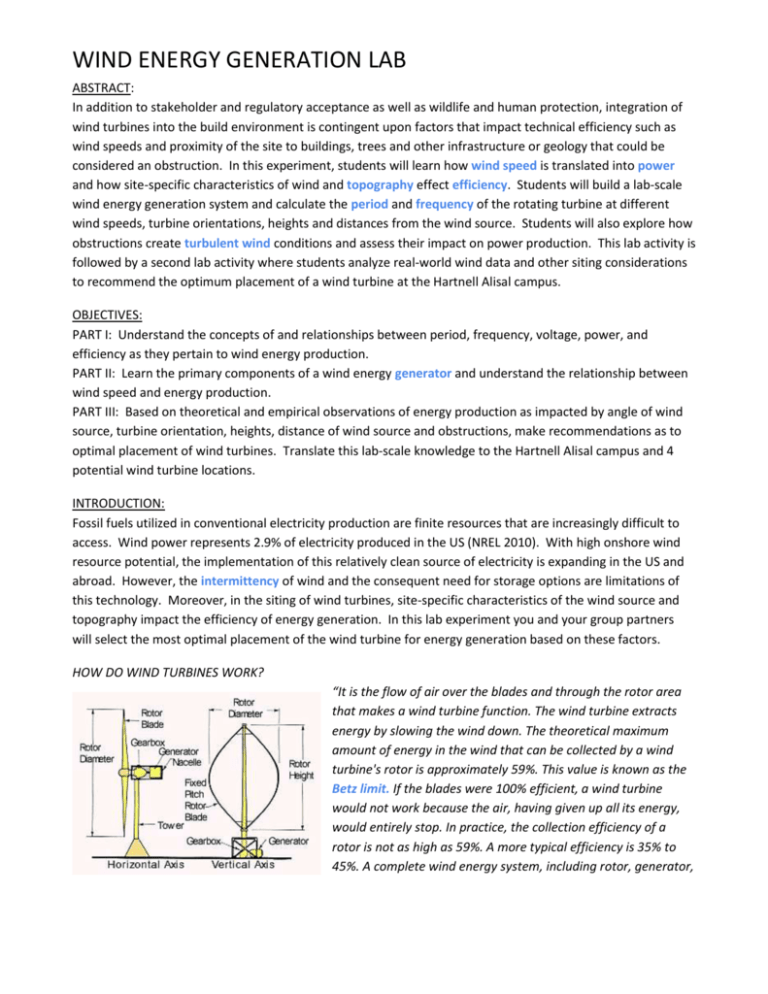
WIND ENERGY GENERATION LAB ABSTRACT: In addition to stakeholder and regulatory acceptance as well as wildlife and human protection, integration of wind turbines into the build environment is contingent upon factors that impact technical efficiency such as wind speeds and proximity of the site to buildings, trees and other infrastructure or geology that could be considered an obstruction. In this experiment, students will learn how wind speed is translated into power and how site-specific characteristics of wind and topography effect efficiency. Students will build a lab-scale wind energy generation system and calculate the period and frequency of the rotating turbine at different wind speeds, turbine orientations, heights and distances from the wind source. Students will also explore how obstructions create turbulent wind conditions and assess their impact on power production. This lab activity is followed by a second lab activity where students analyze real-world wind data and other siting considerations to recommend the optimum placement of a wind turbine at the Hartnell Alisal campus. OBJECTIVES: PART I: Understand the concepts of and relationships between period, frequency, voltage, power, and efficiency as they pertain to wind energy production. PART II: Learn the primary components of a wind energy generator and understand the relationship between wind speed and energy production. PART III: Based on theoretical and empirical observations of energy production as impacted by angle of wind source, turbine orientation, heights, distance of wind source and obstructions, make recommendations as to optimal placement of wind turbines. Translate this lab-scale knowledge to the Hartnell Alisal campus and 4 potential wind turbine locations. INTRODUCTION: Fossil fuels utilized in conventional electricity production are finite resources that are increasingly difficult to access. Wind power represents 2.9% of electricity produced in the US (NREL 2010). With high onshore wind resource potential, the implementation of this relatively clean source of electricity is expanding in the US and abroad. However, the intermittency of wind and the consequent need for storage options are limitations of this technology. Moreover, in the siting of wind turbines, site-specific characteristics of the wind source and topography impact the efficiency of energy generation. In this lab experiment you and your group partners will select the most optimal placement of the wind turbine for energy generation based on these factors. HOW DO WIND TURBINES WORK? “It is the flow of air over the blades and through the rotor area that makes a wind turbine function. The wind turbine extracts energy by slowing the wind down. The theoretical maximum amount of energy in the wind that can be collected by a wind turbine's rotor is approximately 59%. This value is known as the Betz limit. If the blades were 100% efficient, a wind turbine would not work because the air, having given up all its energy, would entirely stop. In practice, the collection efficiency of a rotor is not as high as 59%. A more typical efficiency is 35% to 45%. A complete wind energy system, including rotor, generator, transmission, storage and other devices, which all have less than perfect efficiencies, will (depending on the model) deliver between 10% and 30% of the original energy available in the wind.” (Source: http://energybible.com/wind_energy/wind_speed.html) (Source: http://greenpoweroregon.com/green-power/wind-power.aspx) TAKE PRE-LAB QUESTIONNAIRE online LIST OF MATERIALS → watch Video 1 here: • • • • • • • • • ● • • ● http://classes.soe.ucsc.edu/ee080j/Spring11/Labs/Wind_Power/Lab_Experiment/lab.html ET-generator (1) 5-Blade fan piece [wind turbine](1) Thumb nut (1) Spacer (1) Rod Stand (1) Vernier Lab Pro Sensor (1) Laptop or Desktop Computer with Vernier Logger Pro Program Alligator Clips (2) Wind Power Source (Electric Fan fan) (1) 150 ohms Resistor Plastic container (1) Ruler and measuring tape (up to 1 meter) Masking Tape 2 PROCEDURE: Please follow the instructions and record your observations in the spaces available below. PART I. WIND DIRECTION AND ITS IMPACT ON POWER GENERATION In addition to wind turbine blade design and individual component efficiencies, wind direction directly impacts efficiency in power production. Horizontal axis wind turbines rely upon a yaw mechanism that rotates the wind turbine so that it is always facing the wind direction. Vertical axis wind turbines, by the nature of their omnidirectional design, capture wind from any direction and do not require adjustments in yaw. → Watch Video 2 here. Note that you will not mark as many spots as in the video as shown in the video. 1. Turbine: Place the spacer over the plastic shaft of the ET-generator. Place the 5 blade piece over the same plastic shaft of the ET-generator. Make sure that the 5 blade piece is facing the correct direction. Secure 5-blade piece with thumbnut. Mount the ET generator to the rod stand so that the height of the thumbnut (center of blades) is at about 50 centimeters and tighten it. 2. Mark wind turbine positions with tape as shown in Video 2 and as indicated in the diagram below: 40 cm Multi-speed fan Position 1 position 4 Position 2 position 5 Position 3 position 6 position 7 position 8 position 9 20 cm 10 cm ^ table top ^ 3. Attach the 150 ohms resistor to the ET generator. 4. Attach the alligator clips to the resistor, turn on the fan and leave it at a constant speed for this portion of the lab. 5. Connect Vernier Lab Pro to computer via USB cable. Attach test leads to Lab Pro. Ch.1. 6. Run Vernier Logger Pro. Refer to Figures 1,2 and 3 for guidance on how to record both the voltage and period of the oscillation in Table 1. 3 Figure 1: Vernier Logger Pro Screen Shot: estimate the average of the peaks and read voltage on the y-axis. 7. To determine the period, you must find the difference in the x-values for two consecutive peaks in the periodic signal (t2-t1). To do so, spread out the oscillations by double-clicking on “time” and changing the maximum time on the right to 3 seconds. Use the “x=” tool from the tool bar to get the specific x value for a certain peak. See Figures 2 and 3 below. The period = t2 - t1 = 1.5 – 0.9 = 0.6 seconds. Figures 2 & 3: Vernier Logger Pro Screen Shots: Expand time scale and use “x=” tool to find t1 and t2. 4 8. Repeat steps 6-7 for positions 2-9 with wind turbine placed both straight-forward and angled toward the fan. Table 1: OBSERVATIONS OF THE EFFECT OF YAW ON POWER PRODUCTION Straight-Facing Wind turbine Position Example Period Frequency (seconds) (hertz) 0.6 1/0.6 = 1.67 hz Electromotive Force (Volts) 1.5 Wind Turbine Angled toward Fan Power (watts) Period Frequency (seconds) (hertz) Electromotive Force (Volts) Power (watts) 1.52/150 = 0.015 watts 1 2 3 4 5 6 7 8 9 9. Use the relationship of frequency = 1/period to calculate frequency at each wind turbine position and orientation in Table 1. An example is shown. Recall frequency is proportional to wind speed (as speed increases, so does frequency). 10. Use the relationship between Ohm’s Law: E = I x R and the Power Law: P = I x E to calculate power. Ohms Law is E=IR, where: E = Electro Motive Force which is the voltage rated in Volts (V) = values noted in table I = Current Draw rated in Amps (A) = unknown R = Resistance rated in Ohms (Ω) = 150 Ω Rearranging the equation to solve for the unknown variable, I (Amps), I = E / R Since the Power Law is P=IE, where: 5 P = Power Rated in Watts (W) = unknown I = Current Draw rated in amps (A) = unknown E = Electro Motive Force which is the voltage rated in Volts (V) = values noted in table To find Power in terms of only voltage and resistance, now substitute E/R from above rearrangement of Ohm’s Law into the Power Law for I: Power, P = I x E = E/R x E = E2 / R Now, in Table 1, calculate power by squaring the voltage and dividing by resistance. An example is shown. 11. Repeat calculations in steps 9 - 10 for all wind turbine positions and orientations. What is the most efficient position for each of the two wind turbine orientations (i.e. where is the highest frequency and power produced)? Straight-forward:___________________ Angled toward fan:______________________ PART II. DETERMINING THE IMPACT OF SPEED ON EFFICIENCY Intuitively, one would think that the faster the wind speed (units = meters/second), the higher the frequency and thus the higher the power production of the wind turbine. However, wind turbines are designed to operate within a specific wind speed range. The cut-in speed is the wind speed required to generate usable power. The cut-out speed is the maximum wind speed allowable before creating unstable wind turbine operation and performance. Wind turbines are built with a braking Figure 4: 4KW VAWT Power Curve mechanism that prevents operation of wind turbines above the cut-out speed to prevent damage to the turbine. The relationship between wind speed and power output is usually expressed in a power curve chart, specific to each turbine model. See Figure 4 for an example power curve. 6 1. With the wind turbine in the straight-forward position, run Vernier Logger Pro and using the procedure in steps 6 through 10 in Part I, determine the voltage and determine the frequency at wind turbine positions 4-6 at LOW and HIGH fan speeds. Record in Table 2 below. Table 2: OBSERVATIONS ON THE EFFECT OF WIND SPEED ON POWER PRODUCTION Position Low Speed Period (sec) Frequency (hertz) Electro motive Force (Volts) High Speed Power (watts) Period (sec) Frequency (hertz) Electro motive Force (Volts) Power (watts) 4 5 6 2. What is the most efficient position for each speed (i.e. where is the highest frequency and power)? Low:___________________ High: ______________________ PART III. DETERMINING THE IMPACT OF HEIGHT & OBSTRUCTIONS ON EFFICIENCY Theoretically, obstructions in the wind path to the wind turbine cause a turbulent wind flow region that can be approximately defined by the relationships in Fig. 5 below. Obstructions can both slow down and speed up wind, having varying impacts on wind turbine power production and efficiency. Wind turbine site selection should be outside the turbulent wind flow region, if possible. Figure 5: Defining the region of highly turbulent wind flow (Source: American Wind Energy Association) 7 1. Measure the height of the container: __________cm. The plastic container acts as an “obstruction.” 2. Based on the obstruction diagram in Fig. 5, calculate the turbulent zone envelope for the lab set up, considering wind direction, where H = height of the obstruction as recorded in step 1 above: a. 2H = __________cm b. 20H = __________cm c. Sketch out in plan view (i.e. looking down from top) the turbulent zone envelope with these dimensions, with respect to the wind direction: 3. Align the fan and wind turbine horizontally on the table so that the distance between them is 100 cm, making any obstruction put between the wind turbine and fan within the horizontal component of the turbulent region you calculated above. Put a book under the fan so that it raises the fan an inch or two. Adjust the fan height so that the maximum height of the fan blades is less than 24 cm. You will now investigate how period and voltage change both with and without the obstruction between the fan and wind turbine. 4. Here it is helpful to spread out the oscillations even further on the Logger Pro by decreasing the scale. To do so, change the logger’s sample rate by selecting “Experiment/Data Collection/Sample Rate” from the tool bar and setting “seconds/sample rate” = 0.01. Also, double click on “time” and change the maximum time on the right to 1 second. 5. Removing the obstruction between the fan and wind turbine, turn the fan on the low speed setting, allow the wind turbine to begin rotating and use the Vernier Logger Pro to record the oscillations. To retain the display of oscillations produced without the obstruction, select “Experiment/Store last run” from tool bar. 6. While the fan is running, place the obstruction between the fan and wind turbine, allow the oscillations to stabilize, and run the Vernier Logger Pro again. The display should show oscillations for both scenarios (with and without obstruction) as shown in Figure 6. a. What happens to the period of the oscillations when the obstruction is placed within the turbulent zone? b. What happens to the voltage component of the oscillations when the obstruction is placed within the turbulent zone? Figure 6: Vernier Logger Pro Screen Shot: Dual displays of oscillations both with and without an obstruction between the fan and wind turbine 8 c. Record the period and voltage and calculate the frequency and power produced by the wind source (fan) for the two scenarios in Table 3: Table 3: OBSERVATIONS ON EFFECT OF OBSERVATON ON POWER GENERATION Scenario Period Frequency (seconds) (hertz) Electromotive Force (Volts) Power (watts) With obstruction Without obstruction If time remains, your group can adjust the wind turbine height lower and/or higher and re-run Part III to see how height of the turbine in relation to the obstruction impacts efficiency. Here we have tested the vertical component of the turbulent wind region theory in Figure 5. Because of the small-scale nature of this lab experiment, we cannot test the horizontal component of the theory as the differences in non-turbulent wind flow and turbulent wind flow caused by an obstruction are too small for the Vernier Logger Pro to detect. CONCLUSION: 1. Summarize what you have accomplished in this laboratory by recommending the most efficient wind turbine orientation, position, and wind speed from Parts I & II. 2. In Part III, was the most efficient scenario with or without the obstruction? Were we able to prove the vertical component of the obstruction theory? 3. Does height of the fan in this laboratory experiment necessarily replicate wind conditions at increasing elevations? Why or why not? 9 4. Assuming the prevailing wind direction is SOUTHEAST, use the relationships in Fig. 5 to define the dimensions of the turbulent zone with respect to building height and show them on the following aerial map of the Hartnell Alisal Campus. Note the map scale (the top scale line shown is equivalent to 100 feet and the bottom is equivalent to 50 meters). Use your ruler to determine how many inches are equivalent to 50 meters. Use that relationship in a proportion to determine how many inches = 2H and 20H. Building elevations are shown. What is the maximum vertical elevation to which the turbulent zone extends for each building? If the wind turbine height at any location is to be 30’, which of the potential wind turbine locations, if any, are outside of the turbulent zone, considering both the horizontal and vertical components? 10


