wind_overview
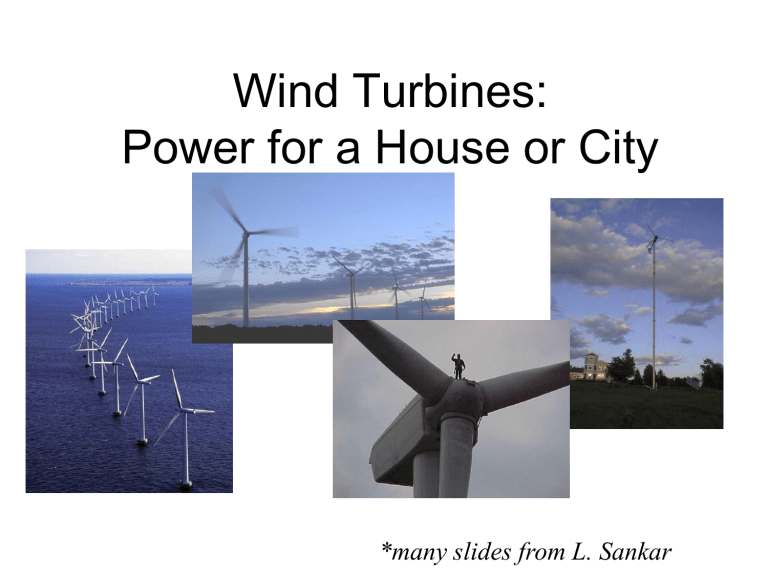
Wind Turbines:
Power for a House or City
*many slides from L. Sankar
coal petroleum natural gas nuclear hydro other renewables wind
Ready to Become a
Significant Power Source
Installed capacity = 35,000 MW as of Dec 2009 (<1% national electricity).
Source: Energy Information Agency coal petroleum natural gas nuclear hydro other renewables wind
With annual growth rates of
~30%, wind could generate
20% of nation’s electricity by 2020.
Wind is Growing Worldwide end 2007
MW new 2008
MW total
25000
20000
15000
10000
5000
0
Rest of World
Europe
United States
1982 1985 1988 1991 1994 1997 2000
Source: AWEA’s Global Market Report
Global Electricity Consumption:
5,000 GW
U.S. Wind Power Capacity Growth: is the rollercoaster over?
Advantages of Wind Power
• Clean
• Flexible
• Large Potential for Growth
• Economically Viable (most of the time – peak opportunity)
Benefits of Wind Power
Environmental
• No air pollution
• No greenhouse gasses
• Does not pollute water with mercury
• No water needed for operations
Benefits of Wind Power
Economic Development
• Expanding Wind Power development brings jobs to rural communities
• Increased tax revenue
• Purchase of goods & services
Benefits of Wind Power
Fuel Diversity
• Domestic energy source
• Inexhaustible supply
• Small, dispersed design reduces supply risk
Benefits of Wind Power
Cost Stability
• Flat-rate pricing can offer hedge against fuel price volatility risk (fuel is “free”!)
• Electricity is inflation-proof
Wind Power Economics
Wind Power Cost of Energy
Components
Cost ( ¢ /kWh) = (Capital Recovery Cost + O&M) / kWh/year
– Capital Recovery = Debt and Equity Cost
– O&M Cost = Turbine design, operating environment
– kWh/year = Wind Resource
Construction Cost Elements
Financing & Legal
Fees
3%
Development
Activity
4%
Interconnect/
Subsation
4%
Interest During
Construction
4%
Towers
(tubular steel)
10%
Construction
22%
Design &
Engineering
2%
Land
Transportation
2%
Turbines, FOB
USA
49%
Cost Nosedive Driving Wind’s
Success
Turbine Technology
Constantly Improving
• Larger turbines
• Specialized blade design
• Power electronics
• Computer modeling produces more efficient design
• Manufacturing improvements
How big is a
2.0 MW wind turbine?
This picture shows a
Vestas V-80 2.0-MW wind turbine superimposed on a
Boeing 747 JUMBO JET
Improved Capacity Factor
• Capacity Factors Above
35% at Good Wind
Sites
– Performance
Improvements due to:
– Better siting
– Larger turbines/energy capture
– Technology Advances
– Higher reliability
Examples: Project
Performance (Year 2000)
Big Spring, Texas
•37% CF in first 9 months
Springview, Nebraska
•36% CF in first 9 months
Offshore wind: a controversial gold mine of energy
“CAPE WIND”: stay tuned…
All offshore wind farms plagued by NIMBY concerns
