Evolution by Natural Selection Worksheet
advertisement
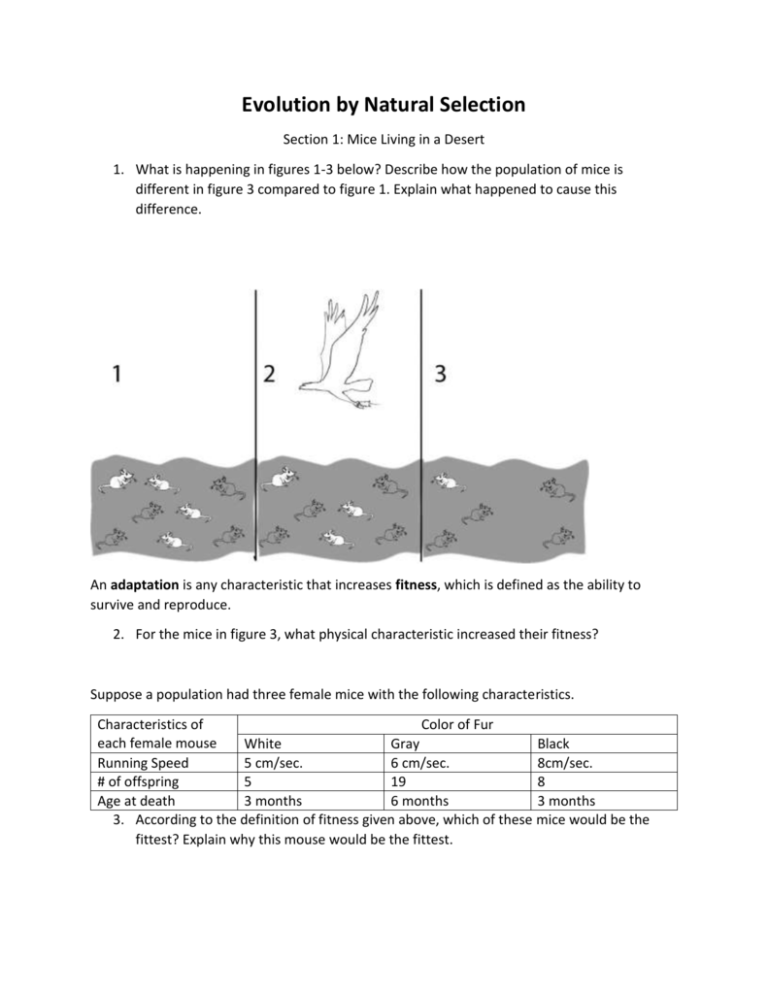
Evolution by Natural Selection Section 1: Mice Living in a Desert 1. What is happening in figures 1-3 below? Describe how the population of mice is different in figure 3 compared to figure 1. Explain what happened to cause this difference. An adaptation is any characteristic that increases fitness, which is defined as the ability to survive and reproduce. 2. For the mice in figure 3, what physical characteristic increased their fitness? Suppose a population had three female mice with the following characteristics. Characteristics of Color of Fur each female mouse White Gray Black Running Speed 5 cm/sec. 6 cm/sec. 8cm/sec. # of offspring 5 19 8 Age at death 3 months 6 months 3 months 3. According to the definition of fitness given above, which of these mice would be the fittest? Explain why this mouse would be the fittest. 4. If a mouse’s fur color is generally similar to its mother’s fur color, which fur color would be the most common among the offspring from the table above? ___black ___gray __white A characteristic that is influenced by genes and passed from parents to offspring is called a heritable trait. Fur color is a heritable trait for mice. In general, individuals with a heritable trait that increases their fitness live longer and produce more offspring than individuals that do not have this trait. Because individuals with this trait have more offspring, there should be more individuals in the second generation that have this beneficial trait. If the trait is still beneficial to the second generation, individuals with this trait will pass it on to their offspring in the third generation. Therefore, over time, beneficial heritable traits tend to become more common in a population. This is a part of the process of natural selection. 5a. Suppose that one day while the mice were sleeping in their burrows, the gray sand of their habitat was replaced with white sand (perhaps the owner of the desert had a plan to attract more tourists). Think about what would happen to the population of mice on the white sand. After a year, which color fur do you think most of the mice would have? __black __gray __white 5b. Explain how the change in color of the sand could eventually result in a change in the most common fur color in this population of mice. 6. When mice live on gray sand, which color fur is a beneficial heritable trait? When mice live on white sand, which color fur is a beneficial heritable trait? Notice that the trait that is adaptive differs in different environments. 7. What is natural selection? As part of your answer, explain why an adaptive heritable trait tends to become more common in a population. Use your own words! Do not copy your notes or your neighbor’s answer verbatim! *Stop! Have Mrs. Dignan check your work from Section 1 before moving on the Section 2 Section 2 – Simulation of Natural Selection Next you will play a simulation game to demonstrate how natural selection works. This simulation involves two populations of “beebos”. One population lives in a White Mountain habitat, and the other population lives in a Brown Scrubland habitat. The only threat to the “beebos” is the presence of ravenous hunters (that’s you!). Each beebo is either brown or white (they’re actually white beans and raisins – shh!). Likewise, each hunter will have either a fork or a spoon as his or her feeding structure. The differences in beebo color and feeding structures are heritable. The offspring of a beebo that survives to reproduce will be the same color as its parent. 8. Your group will simulate the distribution of the beebo population by scattering an equal number of brown and white beebos on both the White Mountain and Brown Scrubland habitats. Which color beebo do you think will be more likely to be captured and eaten in each habitat? White Mountain: Brown Scrubland: Explain the reasons for your predictions: 9. One hunter in your group will have a fork and the other will have a spoon to use as feeding structures. To capture and eat a beebo they must use only their fork or spoon to lift the beebo from the habitat and put it into their stomach (the cup). Which feeding structure do you think will allow a hunter to capture more beebos, or do you think that forks and spoons will work equally well? __Fork __Spoon __Equal Explain the reasons for your prediction: Simulation Procedure: 1. Assign roles within your group (if you have 3 people, the timekeeper and recorder can be the same person): 2 people need to be hunters 1 person needs to be the timekeeper 1 person needs to be the recorder 2. Once roles have been assigned, get materials from Mrs. Dignan. Set up the White Mountain Habitat and the Brown Scrubland habitat (pieces of fabric), on the desks in such a way that both hunters have equal access to each habitat. Randomly assign the hunters to either the fork or the spoon feeding structure. This is the only tool they can use to hunt (you may not use your fingers). 3. Both hunters should look away while the timekeeper and recorder randomly disperse the beebos on both of the habitats. There should be about an even number of both types of beebos on each habitat. The recorder should count the number of each type of beebo in each habitat and record those numbers in the data table below. This is Generation 1. 4. When the timekeeper says start, the hunters have 20 seconds to pick up as many beebos as they can one at a time. All of the beebos must go into the cup, which represents the hunters’ stomach. 5. When the timekeeper says stop, the hunters must stop hunting immediately. Set aside the “eaten” beebos. 6. Simulate reproduction of the remaining beebos. For every beebo that is left in each habitat, simulate the fact that it will likely live to reproduce by adding an identical beebo to the habitat. 7. Repeat Steps 3-7. This time, when the recorder counts the beebos in Step 3, they will record the results in the Generation 2 column of the data table. 8. Repeat Steps 3-7 a third time. This time, when the recorder counts the beebos in Step 3, they will record the results in the Generation 3 column of the data table. Data Table: Generation 1 White Mountain Habitat Brown Scrubland Habitat Brown Beebos White Beebos Brown Beebos White Beebos Generation 2 Generation 3 Graphs: Use the data table to create two graphs that show how the beebo population evolved over 3 generations in each habitat. Each graph should be a double line graph and should include a key. The independent variable (on the X axis) is the Generations. The dependent variable (on the Y axis) is the number of surviving beebos. You will use two different colored lines to represent the two different colored beebos. White Mountain Habitat: Brown Scrubland Habitat: 10. For each habitat, describe the trend in the color of beebos as generations passed. Did one color become more common while the other became less common? Or did they generally stay the same? White Mountain Habitat: Brown Scrubland Habitat: Propose an explanation for these results: 11. Describe the trends in the hunters’ feeding structures. Was one type of feeding structure more successful than the other? Or did they work equally well? __Fork __Spoon __Equally Well Propose an explanation for these results: 12. Were there any other characteristics of the beebos that may have contributed to their survival or death? If so, what were they? Explain how that/those characteristics affected the beebos’ fitness: 13. Did any individual beebos change color or adapt? If not, then why did the colors of the beebos in the final populations differ from the colors of the beebos in the original populations? 14. What do you think would happen to the beebo population if the White Mountain habitat experienced a prolonged heat wave the melted all the snow and exposed brown scrubland beneath?


