OPERATION & PRODUCTION IN INDUSTRIAL MANAGEMENT
advertisement
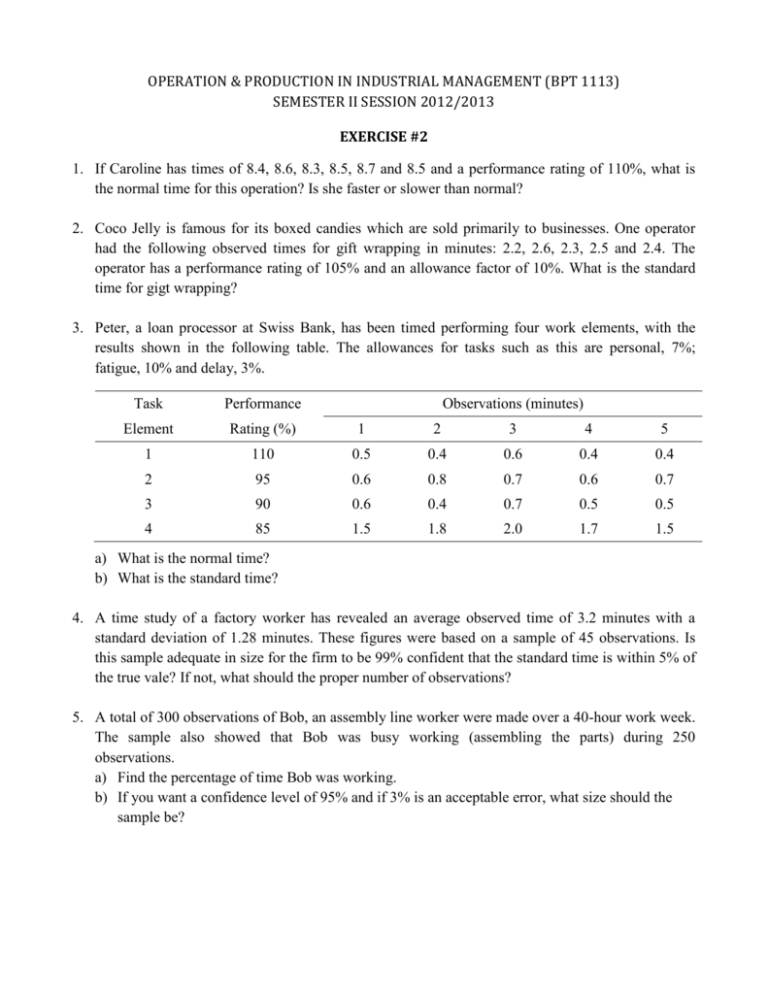
OPERATION & PRODUCTION IN INDUSTRIAL MANAGEMENT (BPT 1113) SEMESTER II SESSION 2012/2013 EXERCISE #2 1. If Caroline has times of 8.4, 8.6, 8.3, 8.5, 8.7 and 8.5 and a performance rating of 110%, what is the normal time for this operation? Is she faster or slower than normal? 2. Coco Jelly is famous for its boxed candies which are sold primarily to businesses. One operator had the following observed times for gift wrapping in minutes: 2.2, 2.6, 2.3, 2.5 and 2.4. The operator has a performance rating of 105% and an allowance factor of 10%. What is the standard time for gigt wrapping? 3. Peter, a loan processor at Swiss Bank, has been timed performing four work elements, with the results shown in the following table. The allowances for tasks such as this are personal, 7%; fatigue, 10% and delay, 3%. Task Performance Observations (minutes) Element Rating (%) 1 2 3 4 5 1 110 0.5 0.4 0.6 0.4 0.4 2 95 0.6 0.8 0.7 0.6 0.7 3 90 0.6 0.4 0.7 0.5 0.5 4 85 1.5 1.8 2.0 1.7 1.5 a) What is the normal time? b) What is the standard time? 4. A time study of a factory worker has revealed an average observed time of 3.2 minutes with a standard deviation of 1.28 minutes. These figures were based on a sample of 45 observations. Is this sample adequate in size for the firm to be 99% confident that the standard time is within 5% of the true vale? If not, what should the proper number of observations? 5. A total of 300 observations of Bob, an assembly line worker were made over a 40-hour work week. The sample also showed that Bob was busy working (assembling the parts) during 250 observations. a) Find the percentage of time Bob was working. b) If you want a confidence level of 95% and if 3% is an acceptable error, what size should the sample be? ANSWER 1. NT = Avg PR = 8.5 1.10 = 9.35 seconds; worker is faster than normal 2. Avg = 2.2 2.6 2.3 2.5 2.4 2.4 minutes 5 NT = 2.4 1.05 = 2.52 2.52 ST 1 0.10 2.8 minutes 3. Observations (minutes) (actual time) Task Element Performance Rating 1 2 3 4 5 110% 95% 90% 85% 0.5 0.6 0.6 1.5 0.4 0.8 0.4 1.8 0.6 0.7 0.7 2.0 0.4 0.6 0.5 1.7 0.4 0.7 0.5 1.5 1 2 3 4 (a) Solutions Actual Time Average NormalTime 0.46 0.68 0.54 1.70 Total 0.506 0.646 0.486 1.445 3.083 Normal time 3.083 minutes Normal time 1 Total allowance 3.083 3.85 minutes 1.0 0.20 (b) Standard time 4. 10.27 2 2 2 (2.58)(1.28) zs 3.30 n 0.16 426 hx (0.05)(3.20) where z 2.58, s 1.28, h 0.05, x 3.20 Sample 5. (a) size 45 is not adequate. They need 381 more observations. 250 .833 83.3% 300 (b) n Z 2 p(1 p) h2 (at 95% confidence level and 3% acceptable error) n (1.96)2 (0.167)(0.833) (0.03)2 (3.84)(0.167)(0.833) 593.7 594 0.0009
